Logging in Kubernetes with Loki and the PLG stack
Observability is a huge topic in cloud-native environments. One must collect, understand, and investigate millions of logs from different sources to understand what’s happening at an application’s runtime. Log stacks - like PLG - address all those concerns and are typically composed of multiple applications with dedicated responsibilities. At the core of every log stack, a log aggregation system is responsible for indexing, storing, and exposing a query interface for log messages.
Loki, built by the incredible team at Grafana, is a scalable log aggregation system highly inspired by Prometheus. Loki is gaining more and more popularity because it is easy to operate and check for resource allocation - especially if you compare it to competitive log aggregation systems. This article will look at the PLG stack, which consists of Promtail, Loki, and Grafana.
- Exploring the PLG stack
- Sample infrastructure in Microsoft Azure
- Deploy sample workload
- Install the PLG stack with Helm
- Accessing Grafana from your local machine
- Query logs using LogQL
- What we covered
- Conclusion
Exploring the PLG stack🔗
Before we dive into installing the PLG stack on a Kubernetes cluster, let’s quickly revisit each of the three major PLG components.Once we have a fundamental understanding of every components main responsibility, we can dive into installing PLG on a shiny new Kubernetes cluster.
What is Promtail🔗
Promtail is responsible for data ingestion into Loki. It’s implemented as a DaemonSet, which means an instance of Promtail runs on every node of your Kubernetes cluster. The DaemonSet periodically reads logs from all containers (stdout and stderr) running on that particular Kubernetes node. On top of localizing and reading the log streams, Promtail can attach labels to logs before pushing them to Loki.
What is Loki🔗
Loki is the heart of the PLG stack. It’s a data store optimized for logs. In contrast to other log aggregation systems, Loki does not index log messages itself. Instead, it indexes labels assigned with every log. We can query logs stored in Loki using LogQL, a query language inspired by PromQL. With LogQL, we can not just dive through millions of logs in seconds. We can also extract metrics from logs with ease.
What is Grafana🔗
Grafana is used to visualize logs stored in Loki. Loki integrates seamlessly with Grafana. We can build individual dashboards in Grafana based on application logs and metrics computed from that logs.
Sample infrastructure in Microsoft Azure🔗
We can install and run the PLG stack on every Kubernetes cluster. For the sake of this article, I’ll use Azure Kubernetes Service (AKS). Provisioning a new Kubernetes cluster in Azure is easy and a matter of minutes. You should use proper Infrastructure-as-Code (IaC) tooling like HashiCorp Terraform or Project Bicep to provision your cloud infrastructure in real-world scenarios. (Find some of my articles on Terraform or Bicep if you want to dive deeper into these topics). For now, let’s use Azure CLI to keep things simple:
# Variables
rgName=rg-loki-sample
region=germanywestcentral

# Create a Resource Group
az group create -n $rgName -l $region

# Create an AKS cluster with two worker nodes
az aks create -n aks-loki-sample -g $rgName -l $region -c 2

# Download Kubernetes credentials
az aks get-credentials -n aks-loki-sample -g $rgName
Deploy sample workload🔗
Although Promtail will read logs from containers in all namespaces by default, we will now deploy a sample application to have some data we can browse through. The sample application, a fake logger, logs messages with a log level of debug, info, and warning to stdout. Logs with error level will be written to stderr.
The actual log messages are produced as JSON. A new log message will be created every 500 milliseconds. A log message looks like this:
{
    "app":"The fanciest app of mankind",
    "executable":"fake-logger",
    "is_even": true,
    "level":"debug",
    "msg":"This is a debug message. Hope you'll catch the bug",
    "time":"2022-04-04T13:41:50+02:00",
    "version":"1.0.0"
}
We can create the deployment using kubectl as shown in the following snippet:
# Create a new Namespace in Kubernetes
kubectl create ns sample

# Create a new Deployment
cat <<EOF | kubectl apply -n sample -f -
apiVersion: apps/v1
kind: Deployment
metadata:
 labels:
  app: fake-logger
  environment: development
 name: fake-logger
spec:
 selector:
  matchLabels:
   app: fake-logger
   environment: development
 template:
  metadata:
   labels:
    app: fake-logger
    environment: development
  spec:
   containers:
   - image: thorstenhans/fake-logger:0.0.2
    name: fake-logger
    resources:
     requests:
      cpu: 10m
      memory: 32Mi
     limits:
      cpu: 10m
      memory: 32Mi
EOF
Once the pod is ready, you can spot the logs using kubectl logs -n sample -l app=fake-logger.
Install the PLG stack with Helm🔗
The easiest way to install the PLG stack on a Kubernetes cluster is by using Helm - the package manager for Kubernetes. Consider reading my “Getting started with Helm 3” article if you haven’t used helm before.
Add the Grafana repository to Helm🔗
Before we can install the PLG stack on our Kubernetes cluster with Helm 3, we must add the official Grafana repository to our local Helm 3 client and update the chart information:
# add Grafana repository to Helm
helm repo add grafana https://grafana.github.io/helm-charts

# update chart information
helm repo update
Having the official Grafana repository added to Helm and updated all chart information, we can inspect which charts are available in the Grafana repository using helm search:
# list all available charts in the Grafana repository
helm search repo grafana/

NAME                            CHART VERSION  APP VERSION   DESCRIPTION
grafana/grafana                 6.24.1         8.4.2         The leading tool for querying and visualizing t...
grafana/grafana-agent-operator  0.1.7          0.23.0        A Helm chart for Grafana Agent Operator
grafana/enterprise-logs         2.0.4          v1.3.0        Grafana Enterprise Logs
grafana/enterprise-metrics      1.8.1          v1.7.0        Grafana Enterprise Metrics
grafana/fluent-bit              2.3.0          v2.1.0        Uses fluent-bit Loki go plugin for gathering lo...
grafana/loki                    2.10.2         v2.4.2        Loki: like Prometheus, but for logs.
grafana/loki-canary             0.5.1          2.4.1         Helm chart for Grafana Loki Canary
grafana/loki-distributed        0.47.1         2.4.2         Helm chart for Grafana Loki in microservices mode
grafana/loki-simple-scalable    0.3.1          2.4.2         Helm chart for Grafana Loki in simple, scalable...
grafana/loki-stack              2.6.1          v2.1.0        Loki: like Prometheus, but for logs.
grafana/mimir-distributed       0.1.2          2.0.0         Grafana Mimir
grafana/promtail                3.11.0         2.4.2         Promtail is an agent which ships the contents o...
grafana/tempo                   0.14.2         1.3.2         Grafana Tempo Single Binary Mode
grafana/tempo-distributed       0.16.8         1.3.2         Grafana Tempo in MicroService mode
grafana/tempo-vulture           0.2.0          1.3.0         Grafana Tempo Vulture - A tool to monitor Tempo...
The output shows that individual charts are available for Promtail, Loki, and Grafana. However, we can install all necessary components at once by using the grafana/loki-stack umbrella chart. Before we install the chart, let’s download the values-file and see what customizations are supported for grafana/loki-stack:
Tailored configuration for the PLG stack🔗
# download value file from grafana/loki-stack
helm show values grafana/loki-stack > ~/loki-stack-values.yml
If we look at the loki-stack-values.yml file, we will immediately recognize that this Helm chart can deploy more than “just” Promtail, Loki, and Grafana. However, we will now customize the value file to deploy just Promtail, Loki, and Grafana:
loki:
 enabled: true
 persistence:
  enabled: true
  storageClassName: default
  size: 50Gi

promtail:
 enabled: true
 pipelineStages:
  - cri: {}
  - json:
    expressions:
     is_even: is_even
     level: level
     version: version

grafana:
 enabled: true
 sidecar:
  datasources:
   enabled: true
 image:
  tag: 8.3.5
For Loki, we configure persistence to store our logs on an Azure Managed Disk with a size of 50 GB. The disk itself is provisioned automatically through the CSI driver. AKS clusters running Kubernetes 1.21 and newer come with CSI drivers for Azure Managed Disks and Azure Files. In the case of Azure Managed Disks, we can choose from two different kinds of managed disks, standard, and premium. Standard Azure Managed Disks are accessible via the storage class default. Depending on your Kubernetes setup or managed Kubernetes vendor, you may have to provide a different storage class. (Use kubectl get storageclass) to get a list of available storage classes in your cluster.
The Promtail configuration is a bit more interesting. First, we can use pipelineStages to tell Promtail how to process logs from particular sources. In this case, we configured promtail to deal with CRI logs correctly before we extracted three essential properties from our JSON logs.
Deploy the PLG stack with Helm🔗
With the customized values-file in place, we can finally install grafana/loki-stack using Helm:
# Install PLG stack
helm install loki grafana/loki-stack -n loki --create-namespace -f ~/loki-stack-values.yml
Use kubectl all -n loki to get a list of all components being deployed to your cluster. You should see the necessary pods moving to the ready state within a few seconds (kubectl get po -n loki):
NAME                            READY   STATUS    RESTARTS   AGE
loki-0                          1/1     Running   0          1m
loki-grafana-6f79895664-qzcpd   2/2     Running   0          4h4m
loki-promtail-p2p9d             1/1     Running   0          4h3m
Accessing Grafana from your local machine🔗
Obviously, we can expose Grafana by deploying an additional Ingress rule to the Kubernetes cluster. However, for the sake of this article, we will use simple port-forwarding. Before we actually start port-forwarding, we have to get the necessary authentication information.
Finding the Grafana password🔗
Grafana is protected via basic authentication by default. We can get the password (username is admin) from the loki-grafana secret in the loki namespace with kubectl:
# Grab the password from loki-grafana secret
kubectl get secret loki-grafana -n loki \
 -o template \
 --template '{{ index .data "admin-password" }}' | base64 -d; echo
Port-Forward from localhost to Grafana🔗
Knowing username and password, we can do port-forwarding using kubectl port-forward and easily access Grafana from our local machine through port 8080:
# find your Grafana Pod
kubectl get pod -n loki -l app.kubernetes.io/name=grafana

NAME                            READY   STATUS      RESTARTS    AGE
loki-grafana-7c97657c96-xm9xx   2/2     Running     0           1m

# Start port forwarding
kubectl port-forward -n loki loki-grafana-7c97657c96-xm9xx 8080:3000

Forwarding from 127.0.0.1:8080 -> 3000
Forwarding from [::1]:8080 -> 3000
Query logs using LogQL🔗
This article is not considered to be an end-to-end tutorial on LogQL, instead consult the official LogQL documentation to dive deeper into LogQL. If you have not worked with LogQL or PromQL before, consider reading the corresponding section of the Loki documentation. With LogQL, we can browse millions of log messages in no time by filtering based on labels or the underlying log messages themselves.
Some fundamental LogQL queries🔗
For demonstration purposes, let will use Grafana’s Explore (🧭) to browse our logs. We can restrict responses to receive log messages only produced in the sample namespace by using the label filter {namespace="sample"}.
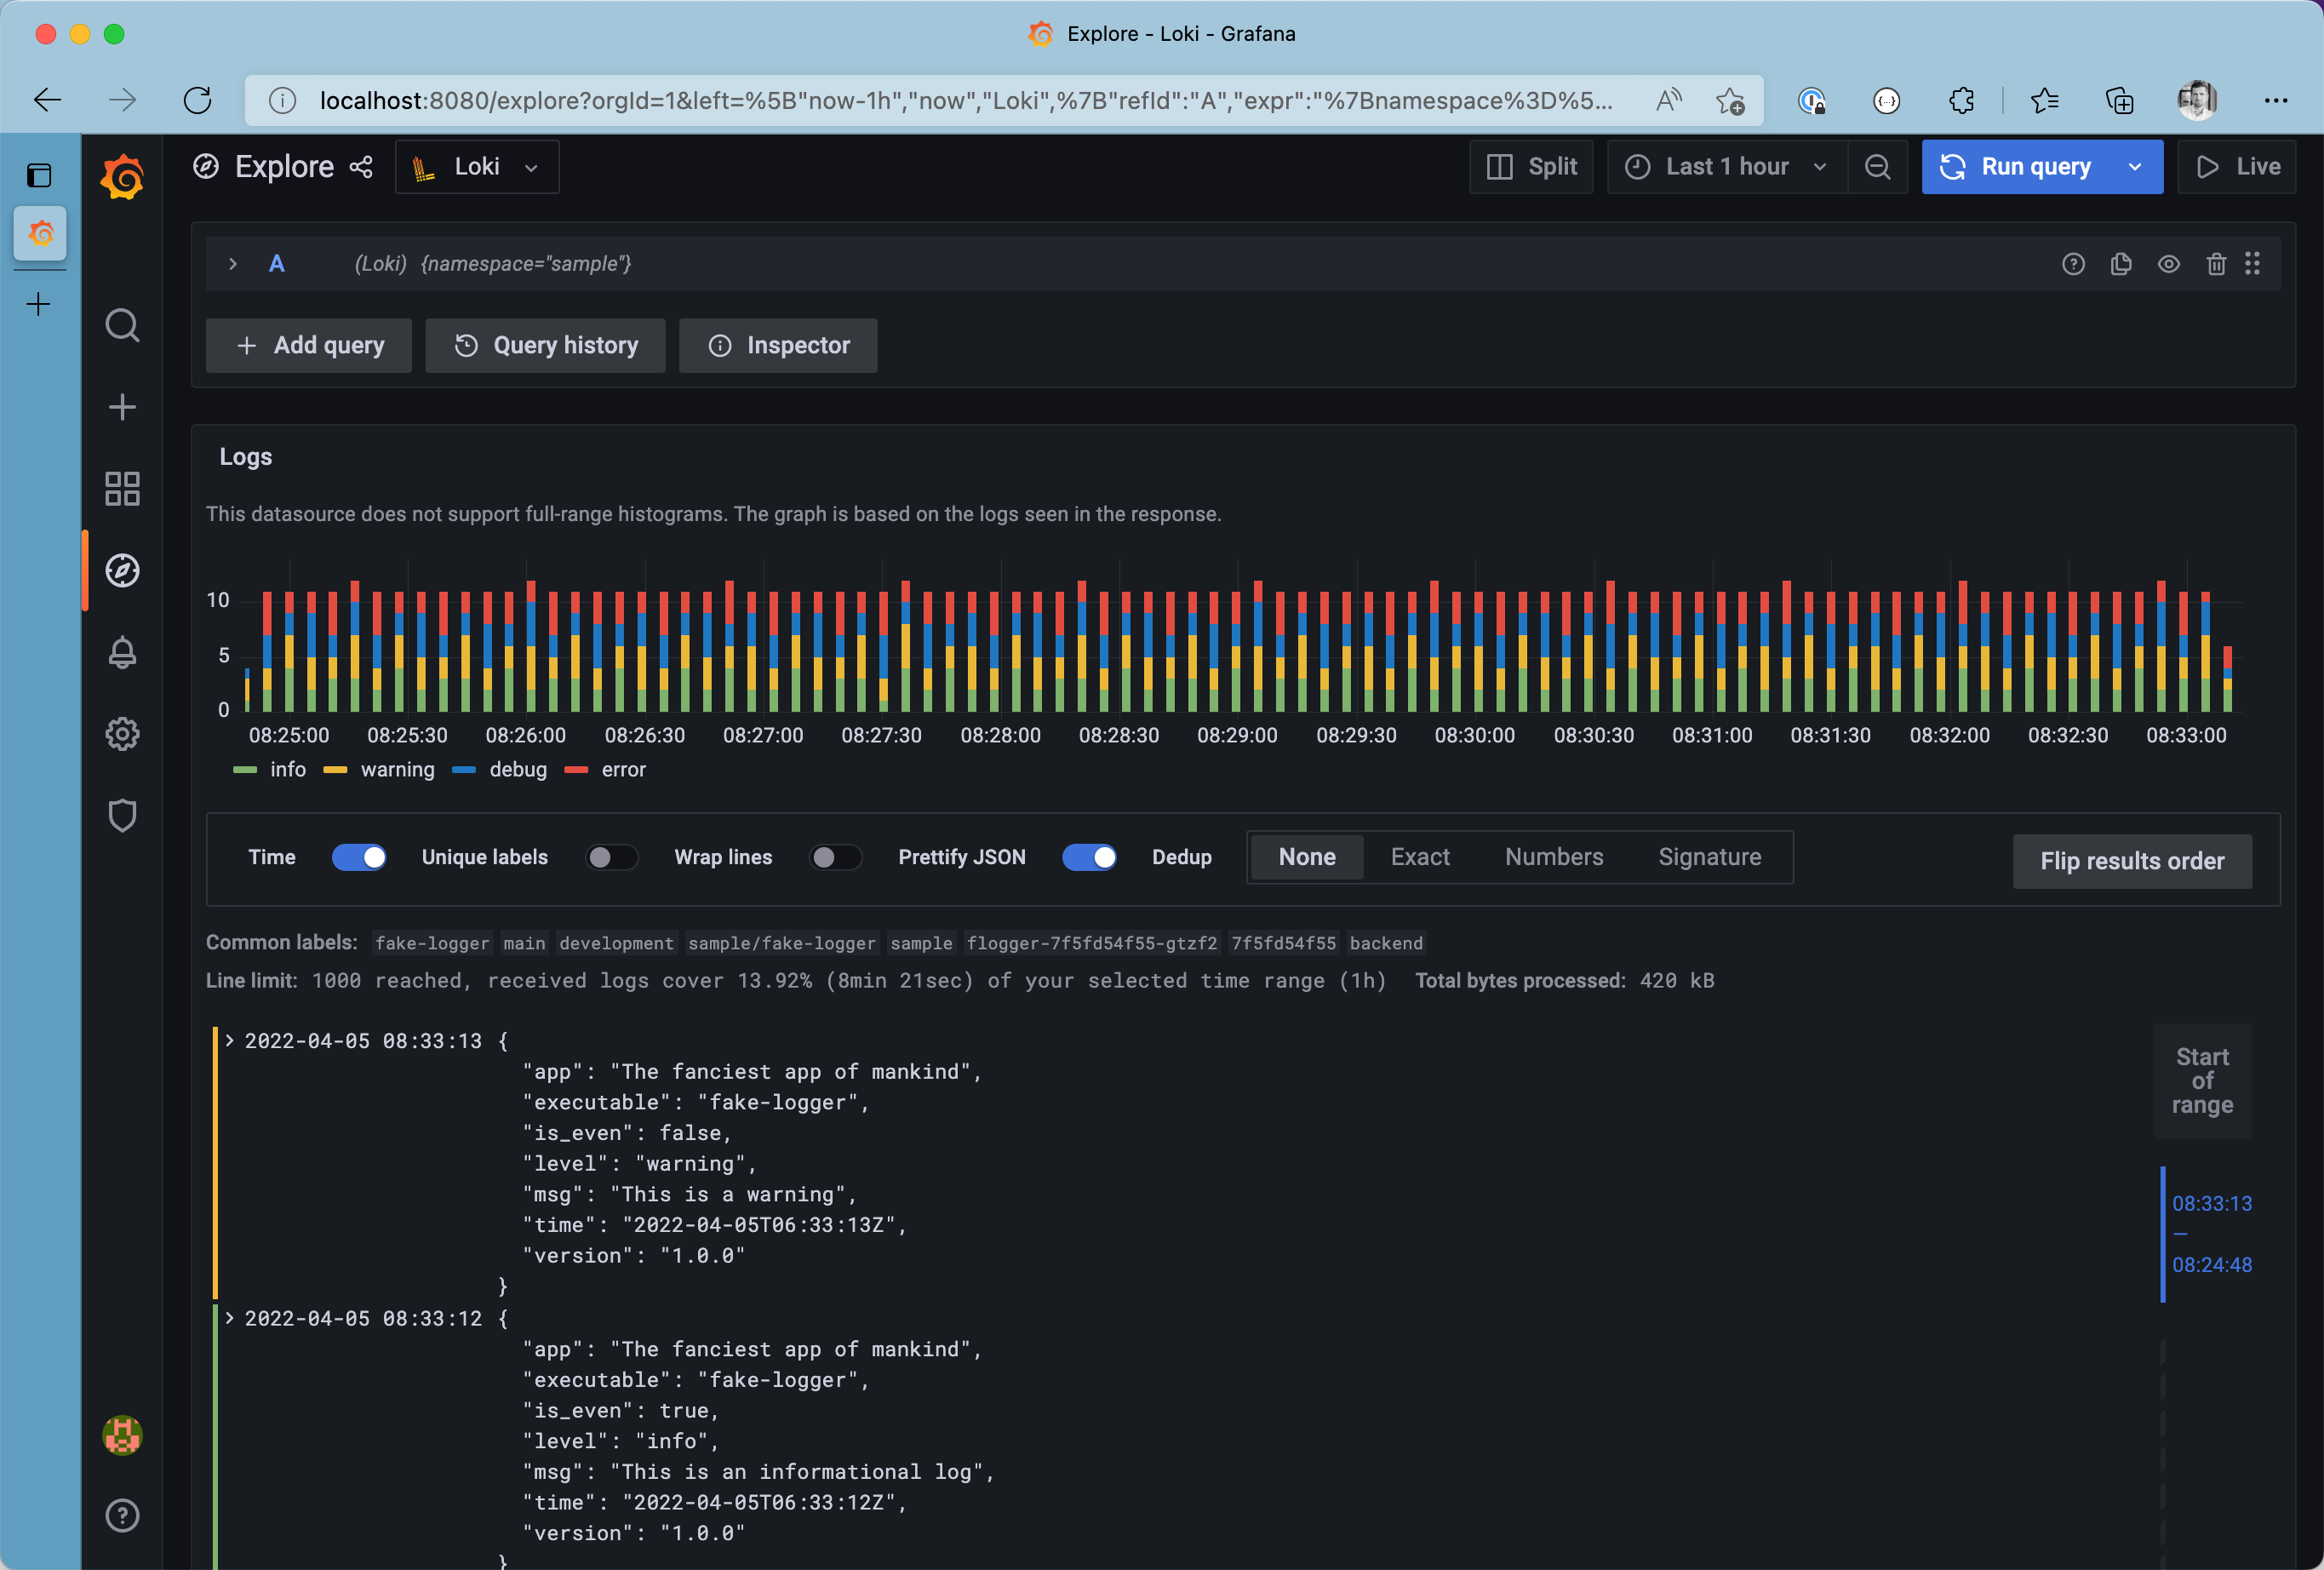
All logs from the sample namespace
Do you want to see only logs from stderr? We can concatenate multiple label filters to narrow down the list of results even more {namespace="sample", stream="stderr"}. Take your time and browse through the log browser, to spot all labels attached to log messages from Promtail before ingesting the logs into Loki.
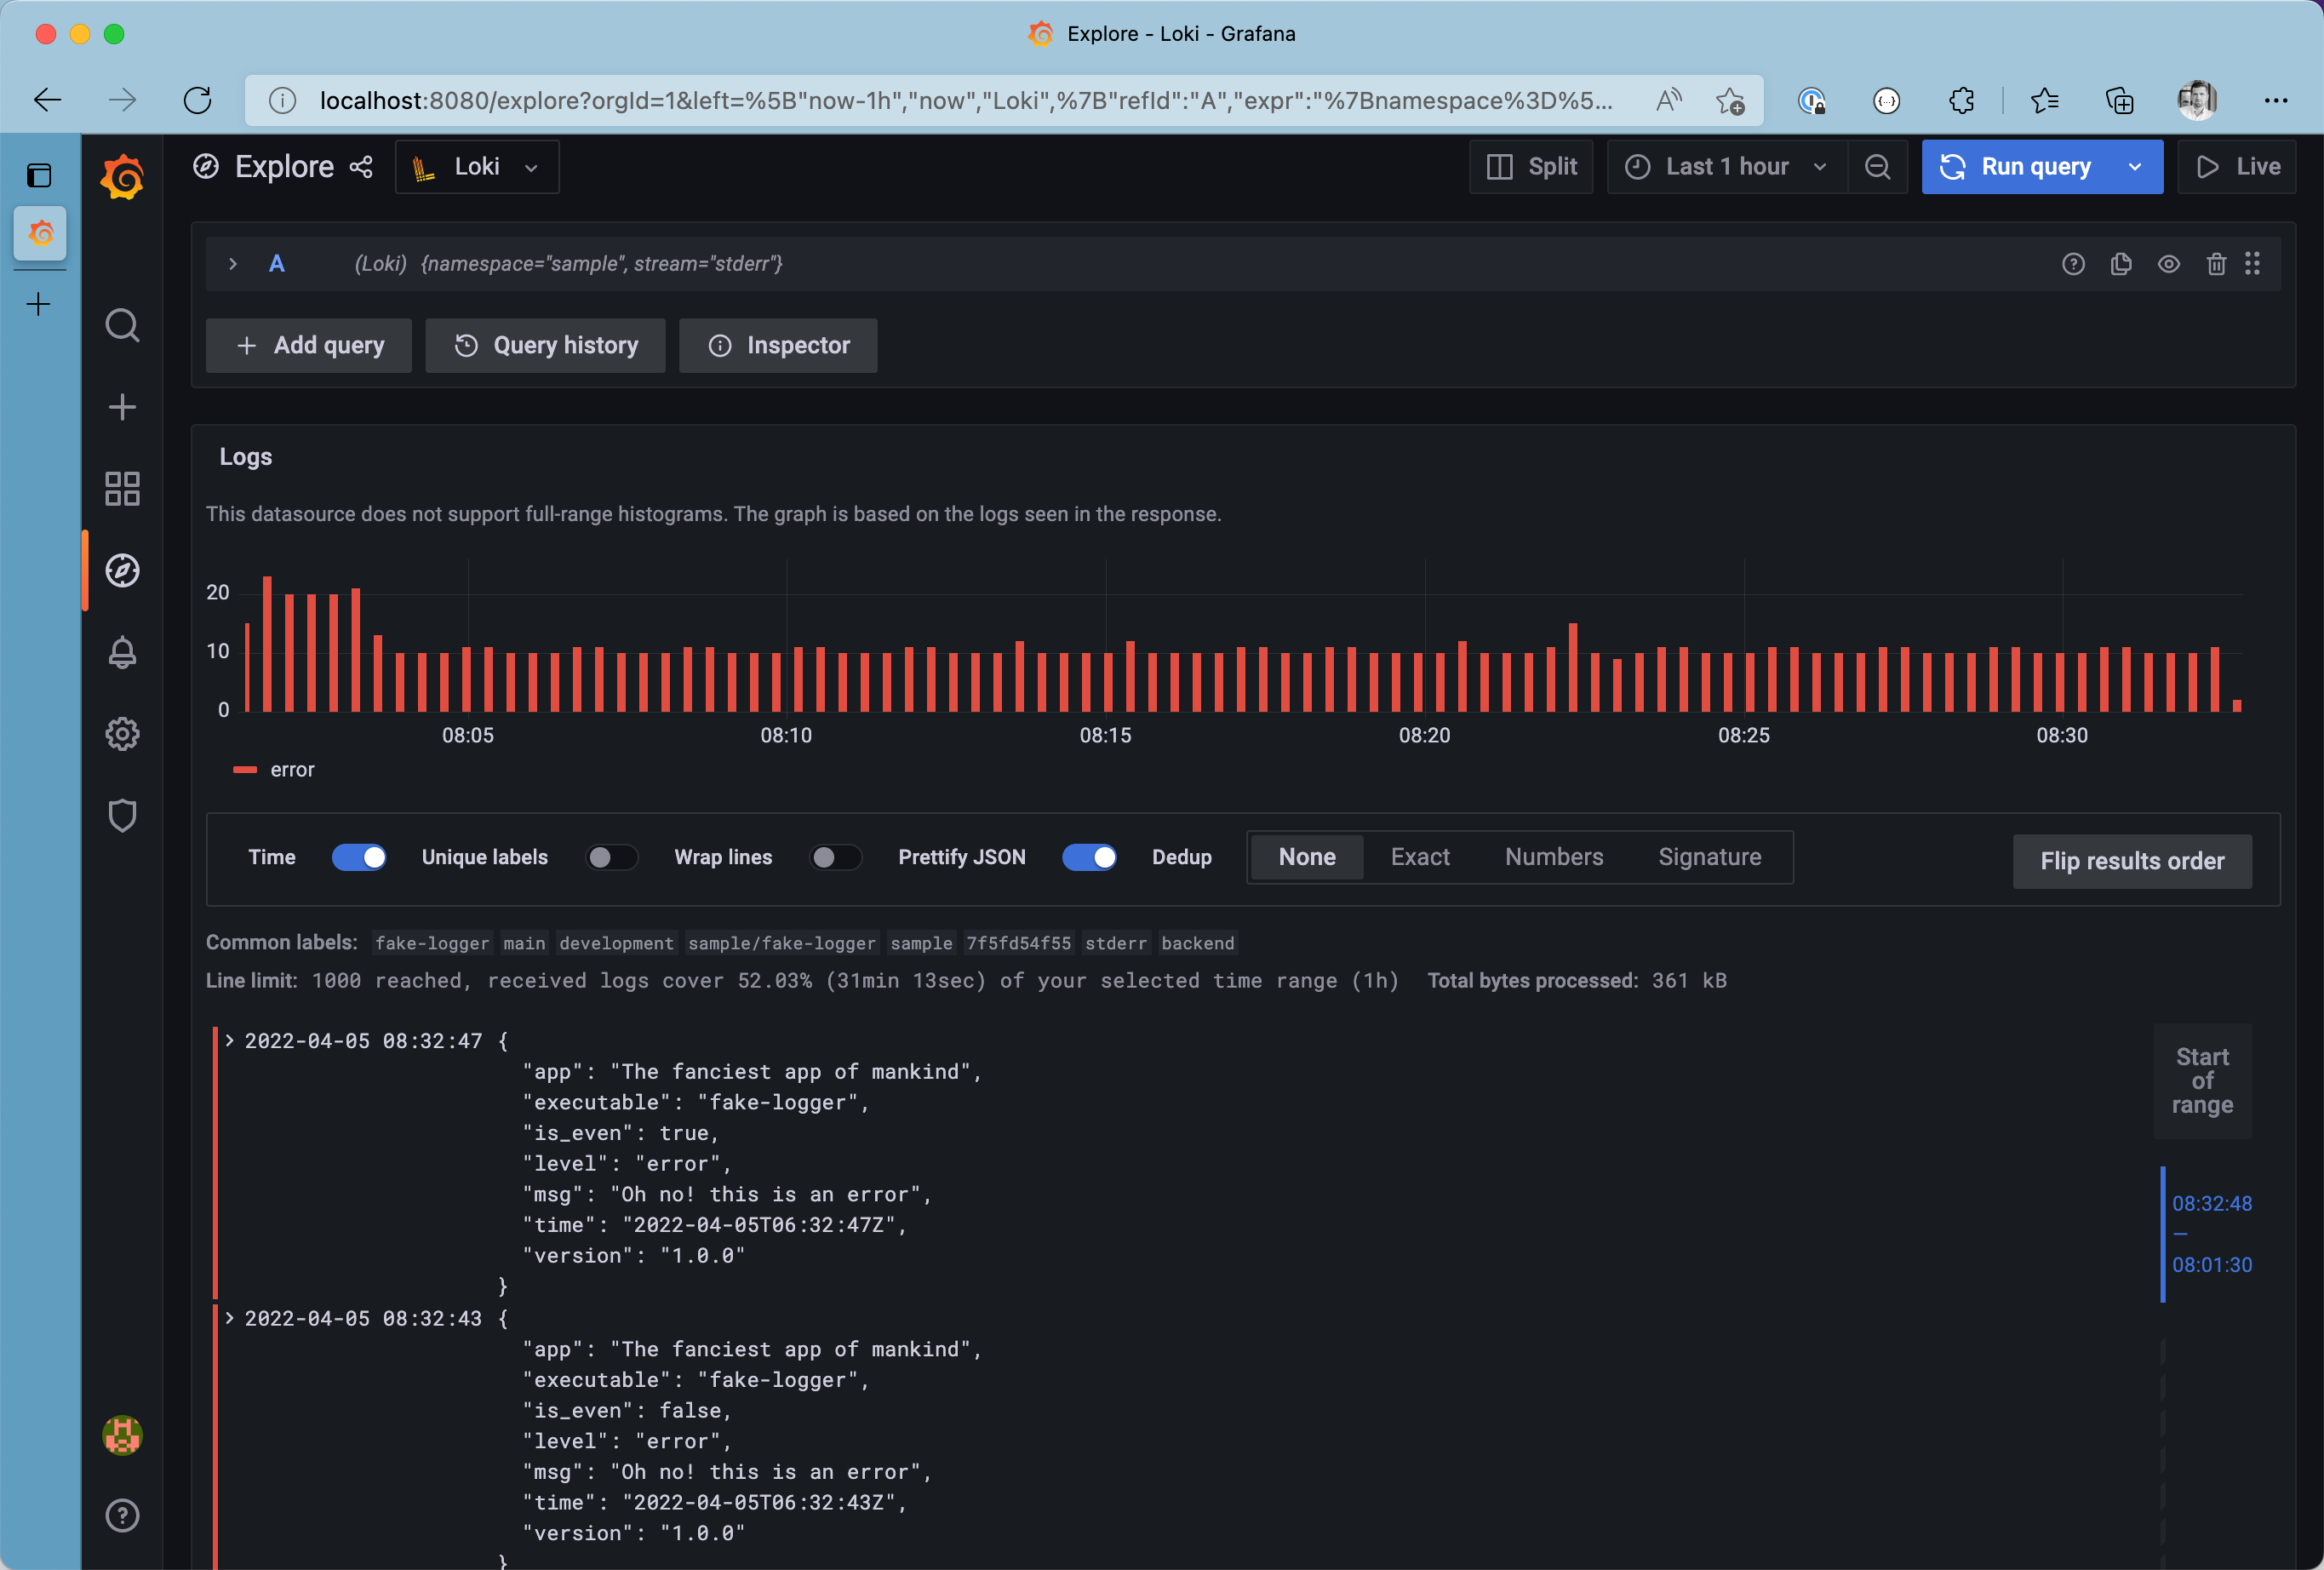
All logs from the stderr stream in the sample namespace
From this point, we can make the query even more precise by filtering on detected fields from the JSON log message itself. Use the json formatter and filter the list to see only messages with is_even set to true. Last but not least, we can filter results by looking for the occurrence of a particular string. This leads to the final query being {namespace="sample", stream="stderr"}|json|is_even="true".
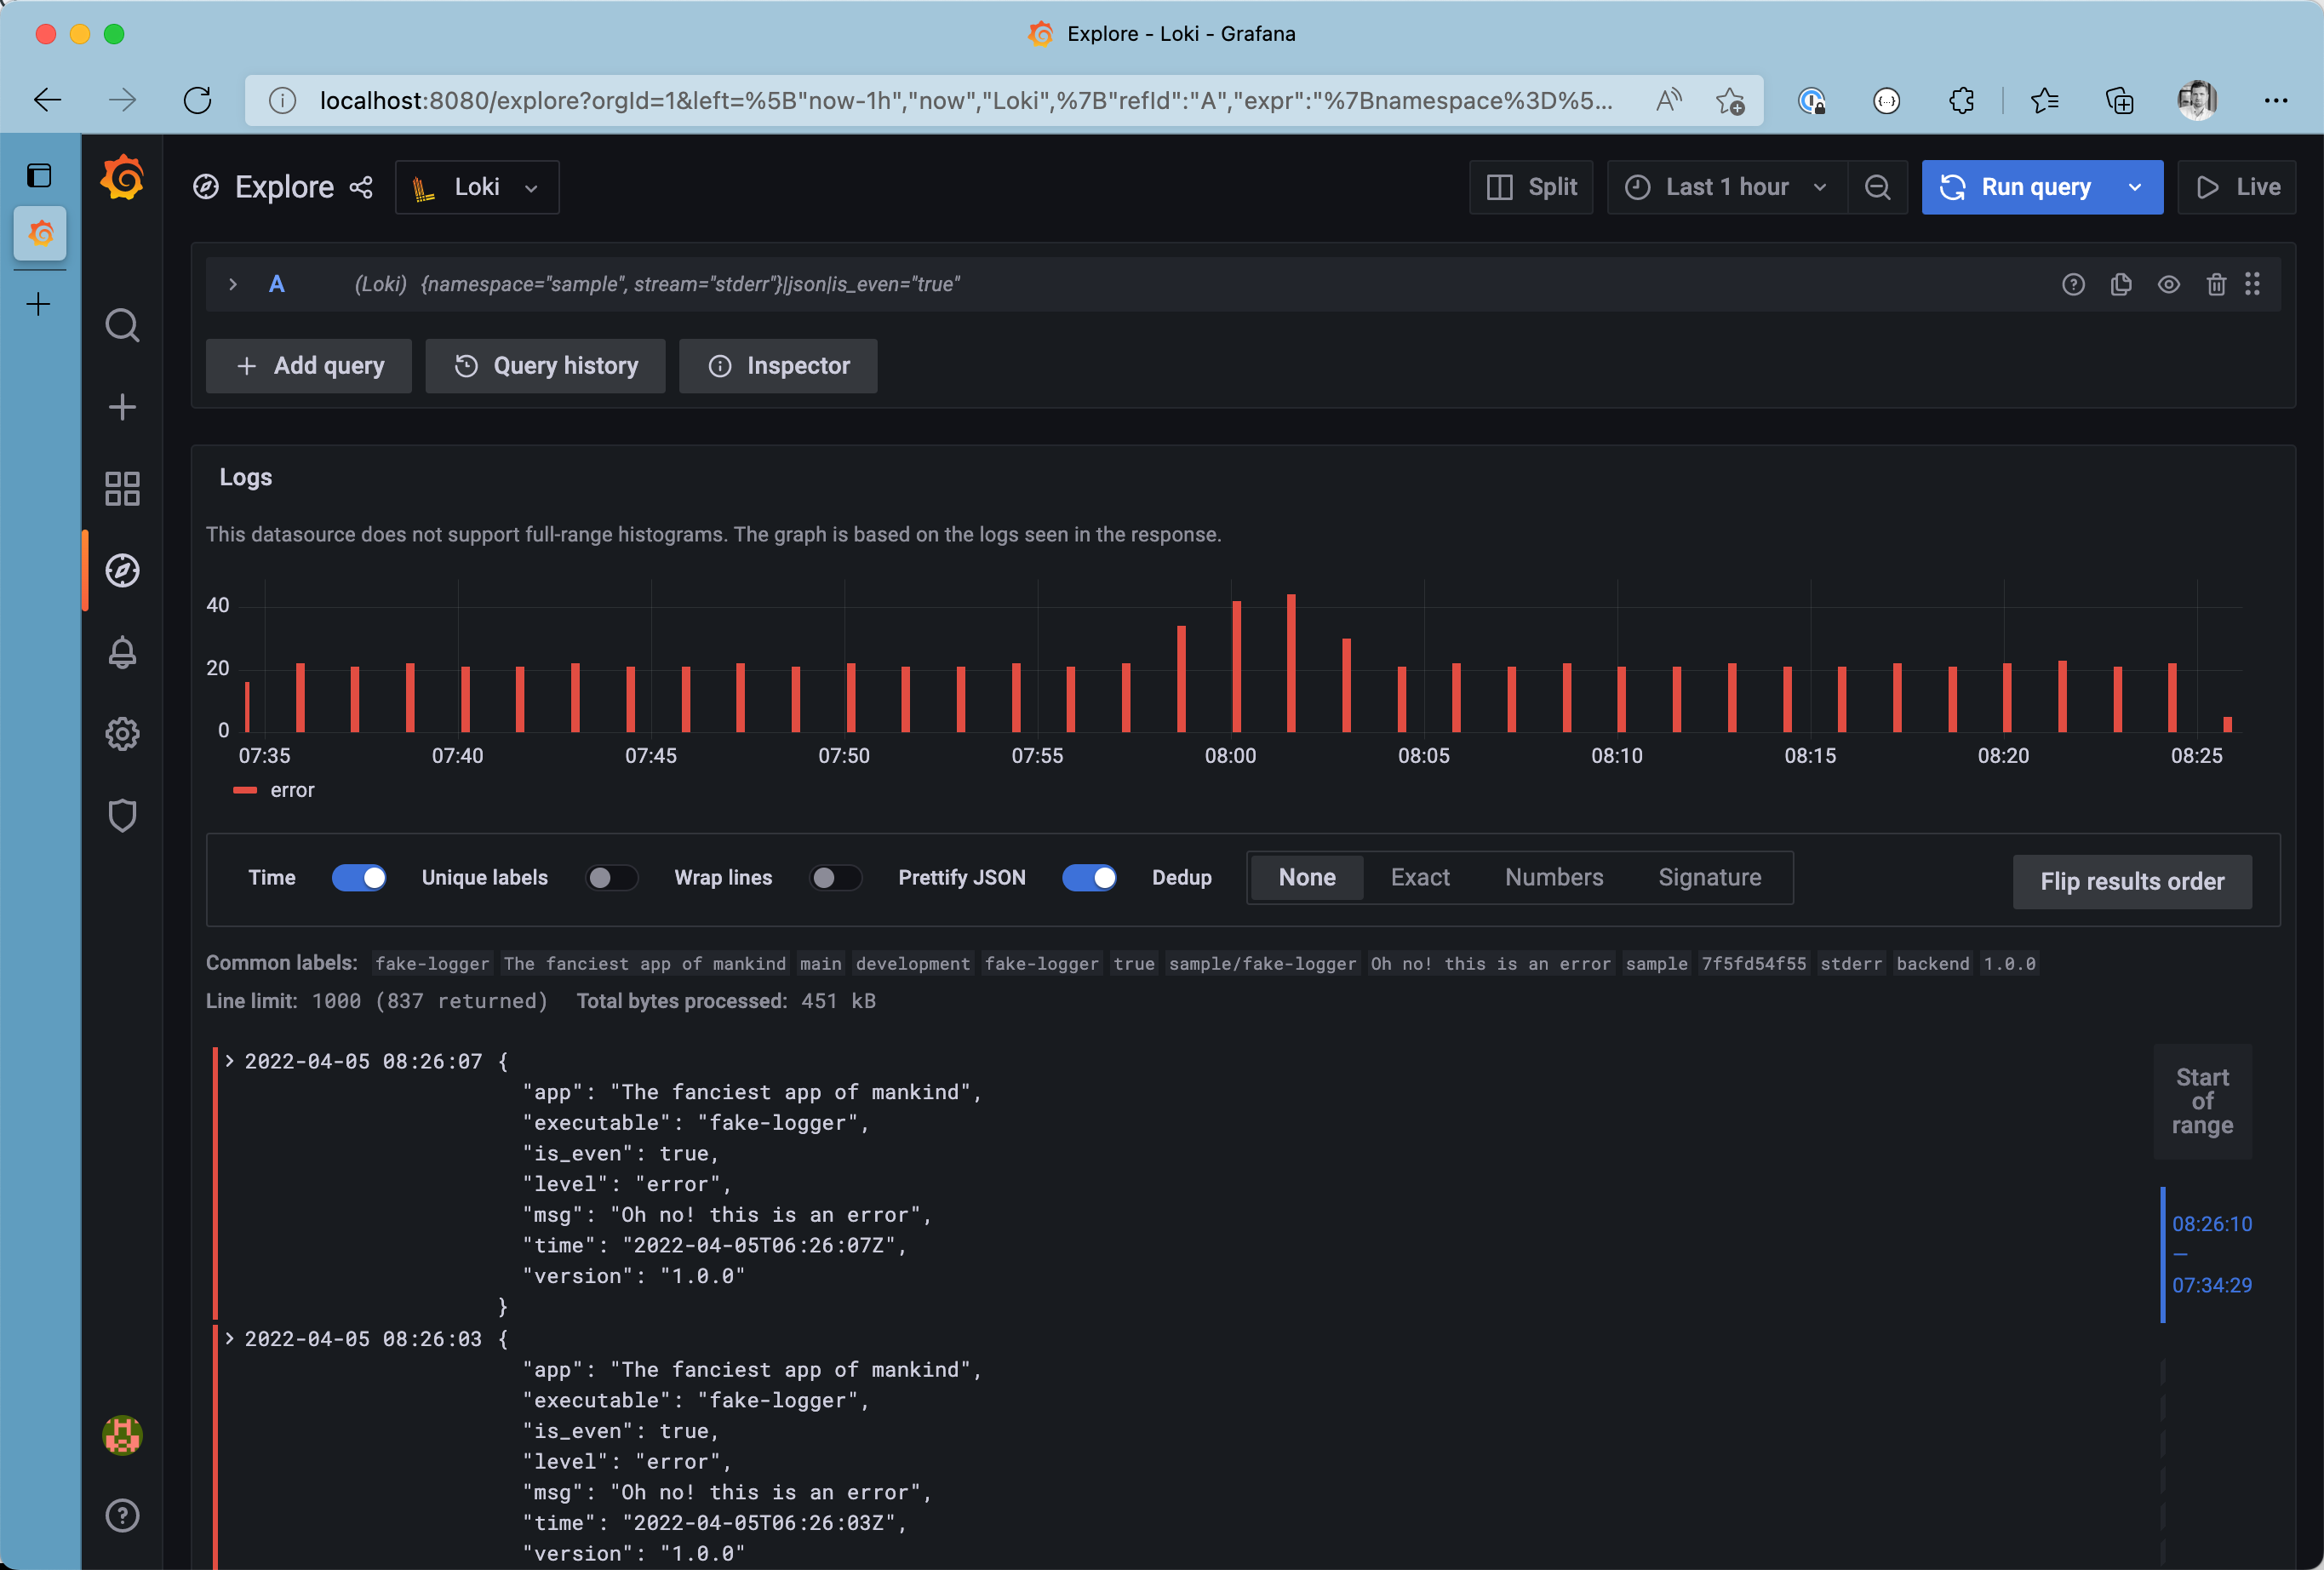
All even logs from the stderr stream in the sample namespace
Although having structured data - such as JSON - is great, its easier to spot certain patterns in plain old strings. Let’s use the line_format expression to modify the final representation of our log messages by modifying the query to {namespace="sample", stream="stderr"}|json|is_even="true" | line_format "{{.ts}} {{.level}}@{{.pod}}| {{.msg}}"
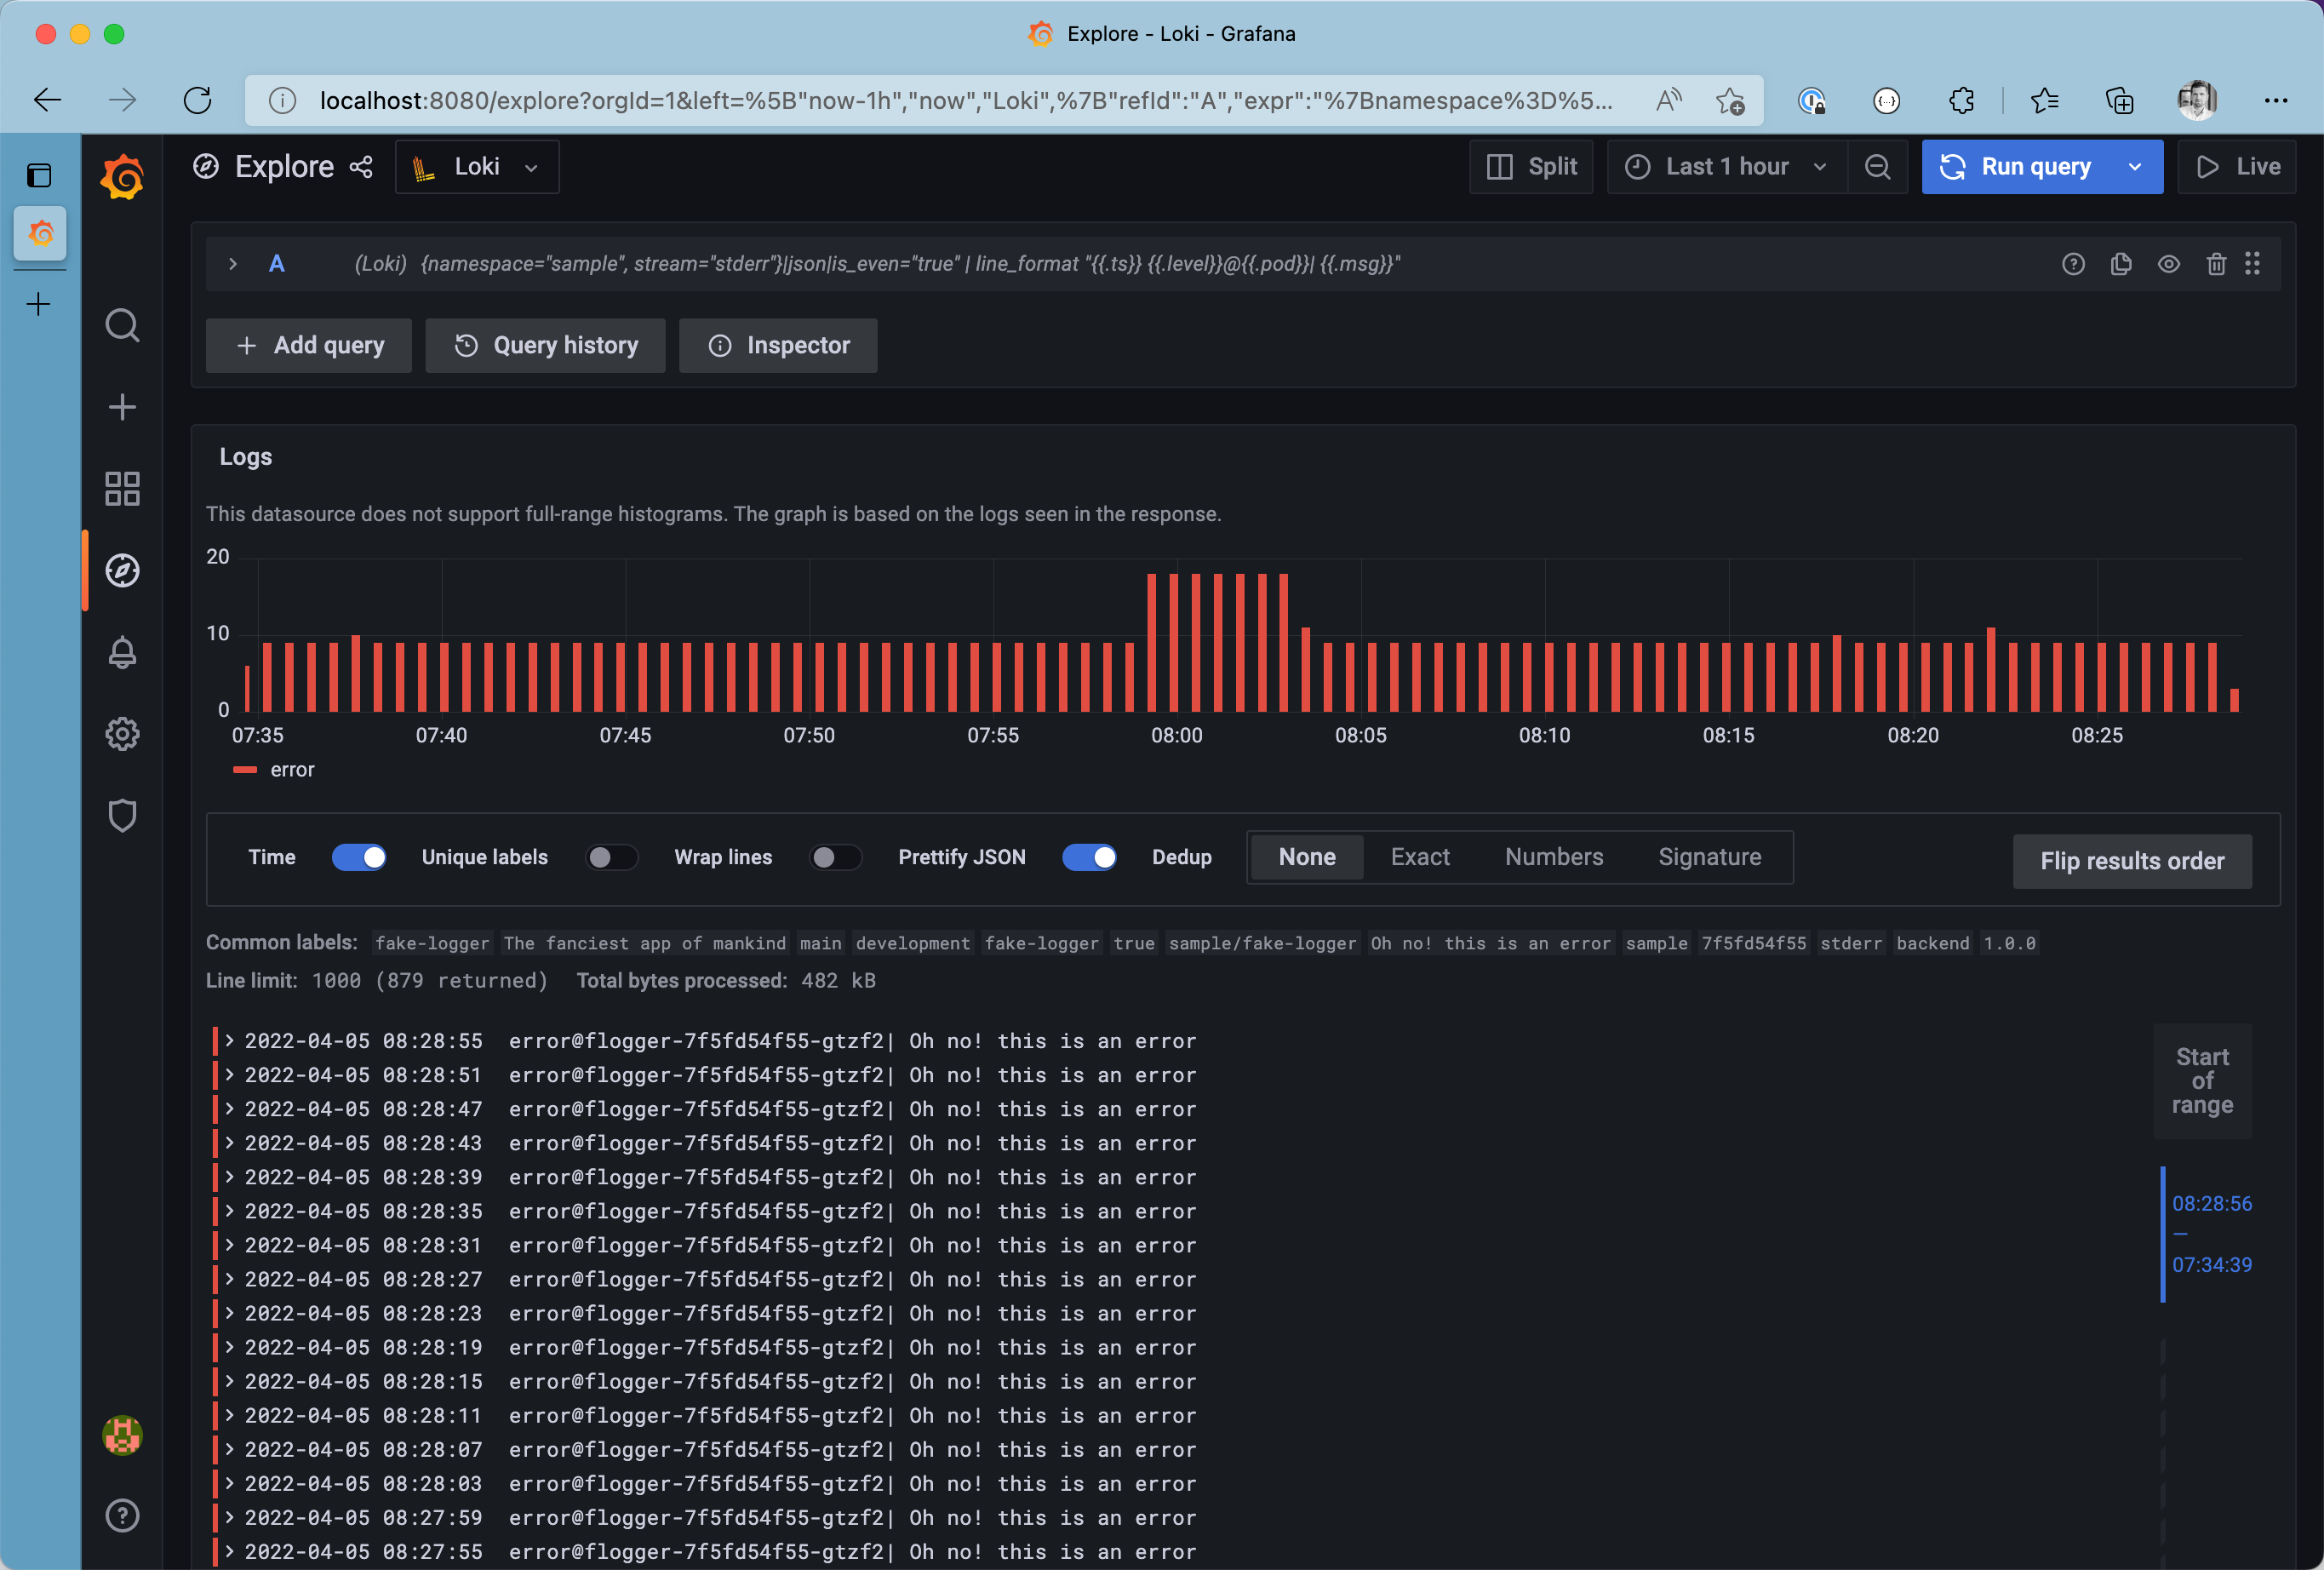
Logs with custom line format
Metrics based on logs with LogQL🔗
LogQL is super strong when diving through thousands or even millions of log messages. On top of that, LogQL has built-in support to generate fundamental metrics from log messages. For example, we can get the number of errors produced in the sample namespace (within a five minute time window) and display it on a Grafana dashboard using the query sum(count_over_time({namespace="sample",stream="stderr"} [5m]))
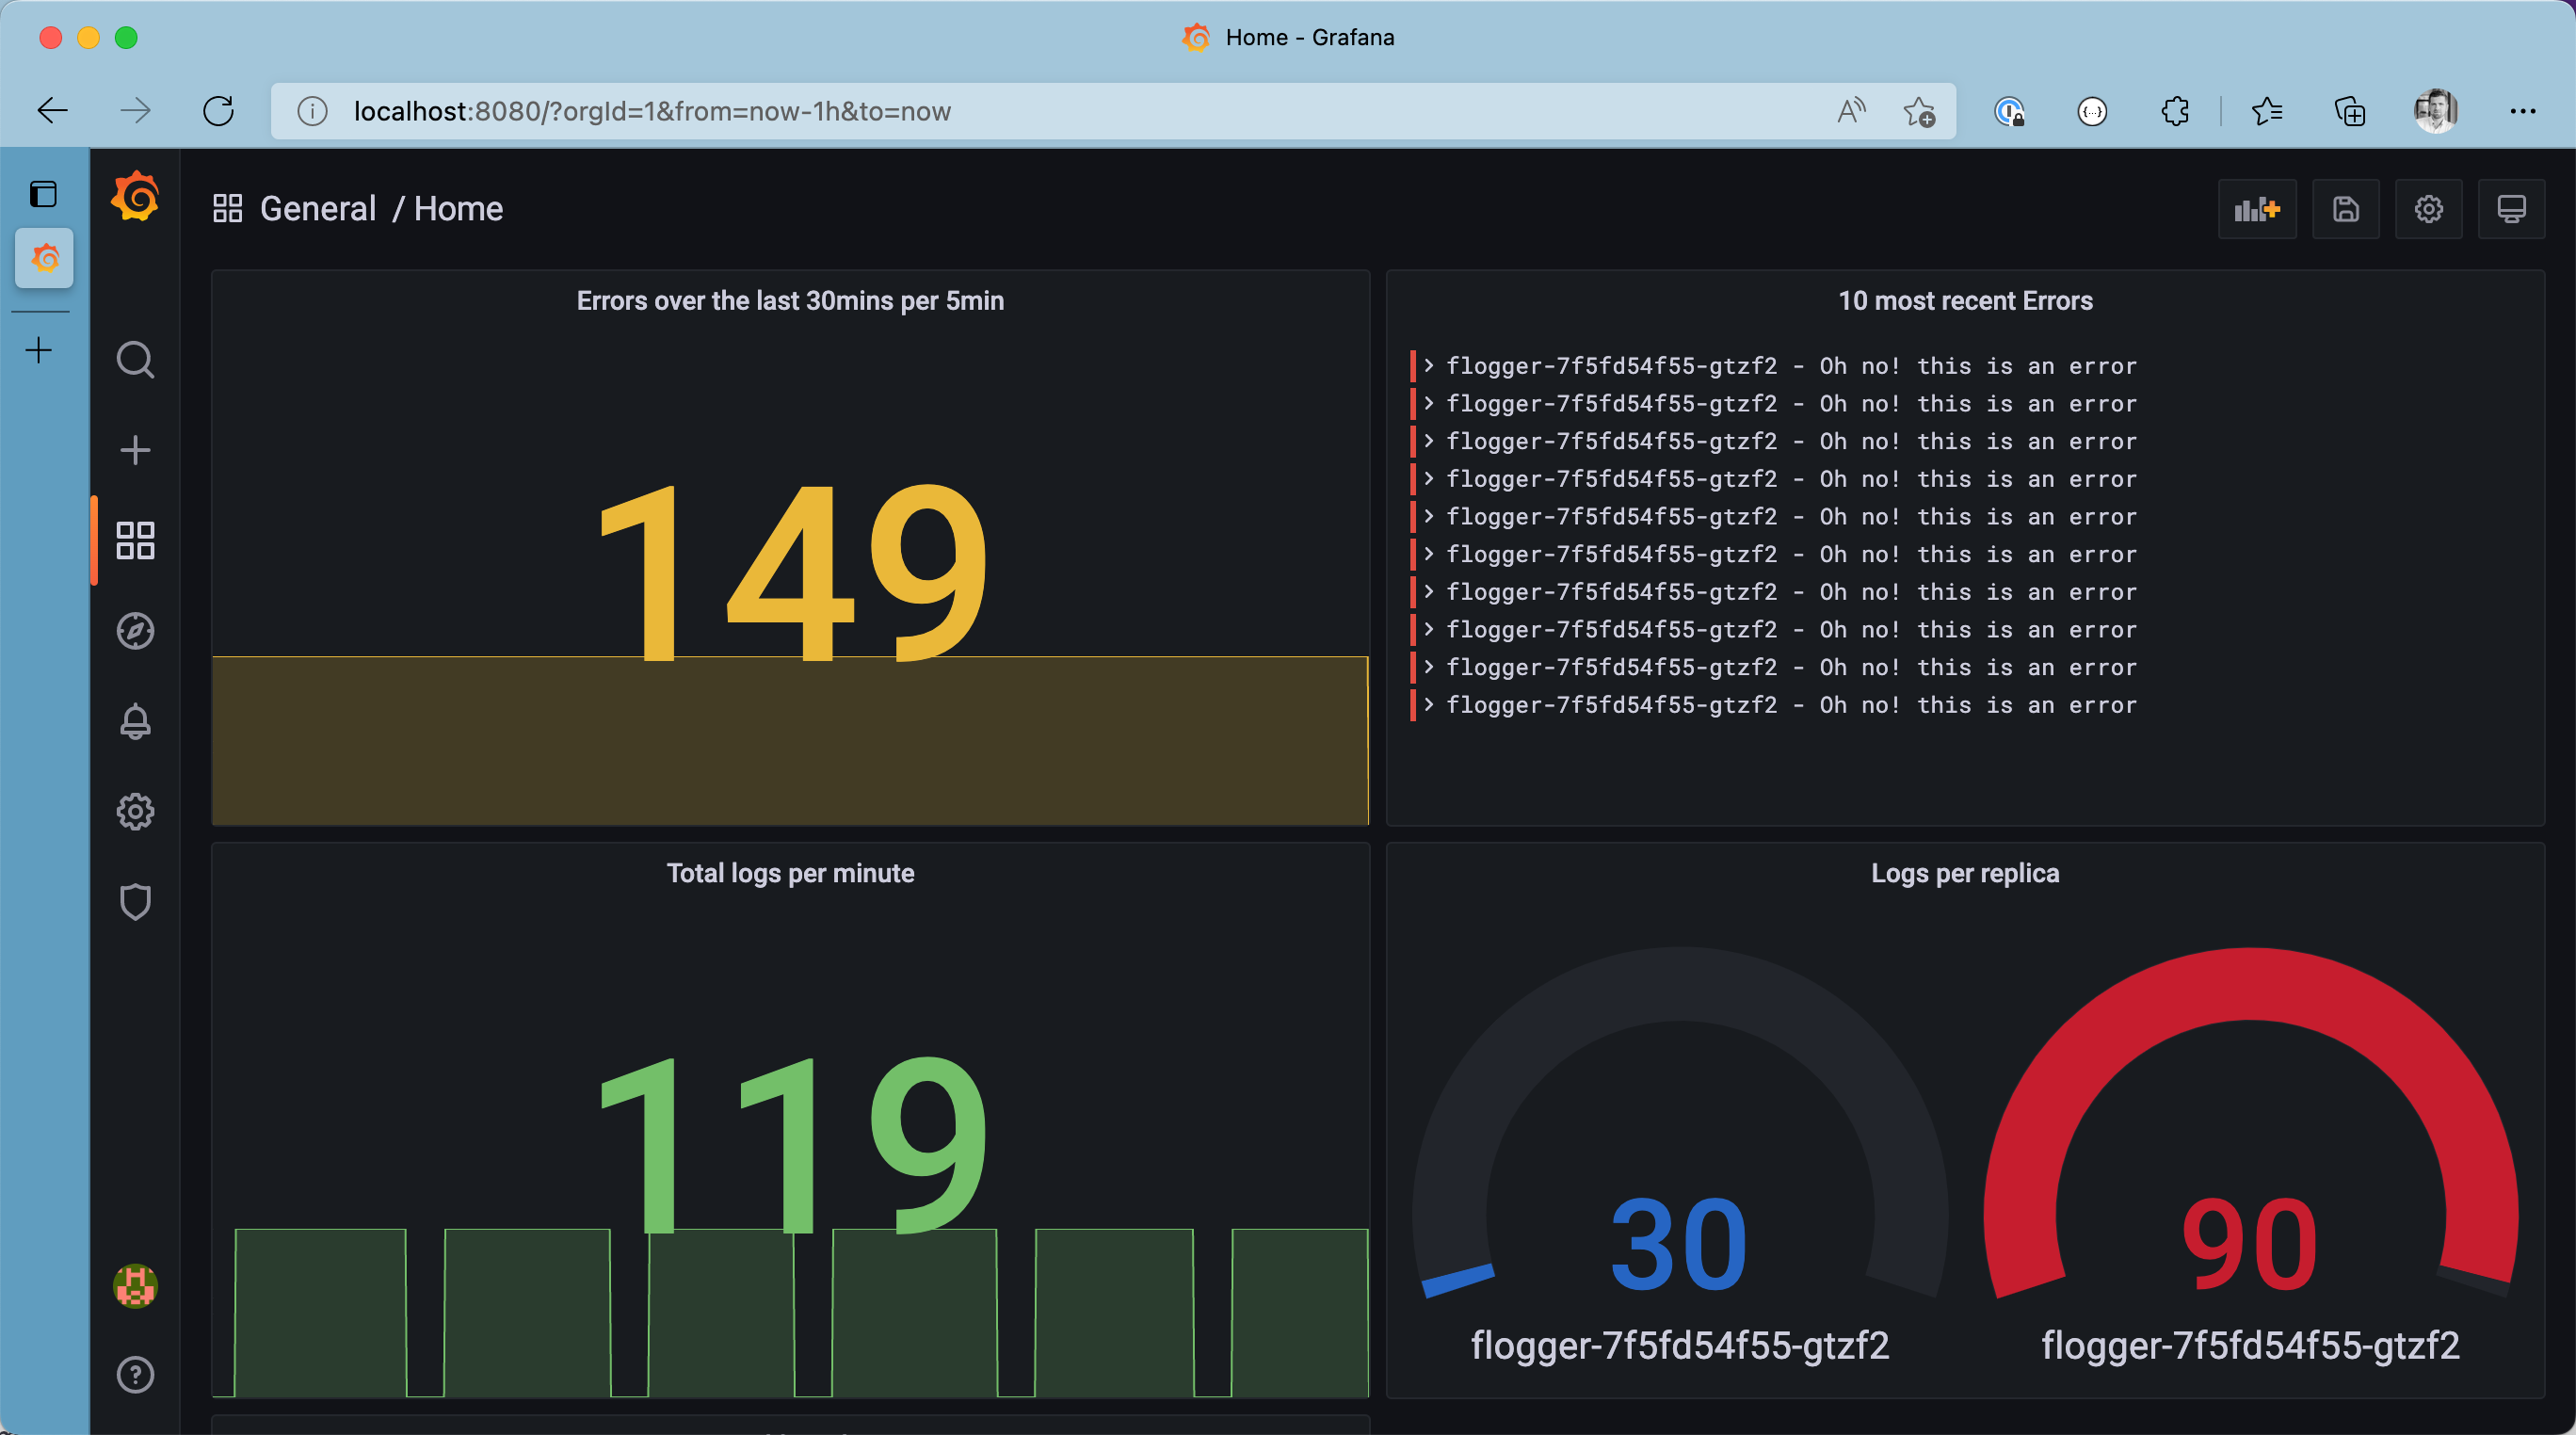
Metrics based on logs on the Grafana Dashboard
Keep in mind: It’s always a good practice to narrow down logs by applying at least one label filter before filtering based on un-indexed log messages.
What we covered🔗
Over the course of this article we covered:
- 💡 Understand the core components of the PLG stack and its responsibilities
- 👷🏻♂️ Deploy a Loki Stack with a custom configuration using the
grafane/loki-stackHelm chart - 💾 Ensure logs are persisted by referencing a Kubernetes StorageClass
- 🖥 Deploy a sample workload
- 🧐 Browse through produced log messages with Grafana and LogQL
- 💯 Extract metrics from log messages with LogQL
Conclusion🔗
Discovering logs in distributed applications can be cumbersome. Logs from different formats must be unified and consolidated. The PLG stack is a lightweight solution to scape, store, and visualize logs in Kubernetes clusters. The grafana/loki-stack umbrella chart used in this article makes deployment easy. A customized Promtail configuration is a must-have to control different log formats and unify upon ingestion.
Although I recognized that it was hard to remember the LogQL syntax - after not using it for a while, I like the possibility of extracting metrics from log messages in no time and integrating those metrics into existing Grafana dashboards.