Instrumenting .NET Apps with OpenTelemetry
Instrumenting applications is critical to address observability in cloud-native. Receiving detailed traces, metrics, and logs in distributed application architectures is mission-critical regarding monitoring and troubleshooting.
This article will look at OpenTelemetry and instrument a .NET application to ensure our overall application becomes observable at runtime.
- What is OpenTelemetry
- The sample application
- Instrumenting a .NET Application with OpenTelemetry
- Filtering Traces with custom Samplers
- Custom signals with OpenTelemetry
- Kubernetes Deployment
- What we’ve covered in this article
- Conclusion
What is OpenTelemetry🔗
Before we dive into the actual example, let’s do a quick refresher on OpenTelemetry, to ensure everybody is on track. OpenTelemetry (often referred to as OTel) is an open-source observability framework. It is a CNCF (Cloud Native Computing Foundation) project and has been on the incubating maturity level since May the 7th of 2019. Historically, OpenTelemetry was started by combining two existing projects in the observability space OpenTracing and OpenCensus.
OpenTelemetry
OpenTelemetry is a collection of APIs, SDKs, and tools. OpenTelemetry SDKs are available for many popular programming languages to unify instrumentation implementation across our industry.
OpenTelemetry allows developers to instrument, generate, collect, and export signals of different kinds. Currently, OpenTelemetry defines four different types of “signals”:
- Logs: Timestamped (structured or unstructured) messages emitted by services (code) or dependent components.
- Metrics: Aggregated (numeric) values over a period of time. (E.g., CPU utilization, incoming HTTP requests per second, …)
- Traces: Collection of linked spans illustrating how requests “flow” through a distributed application
- Baggage: Contextual information passed between spans
OpenTelemetry integrates with well-known observability platforms or products. For example, you could use popular systems like Jaeger, or Zipkin (to name just two of them) for visualizing distributed traces of your application. In OpenTelemetry, we use so-called exporters to emit telemetry to a particular “consumer-system”.
Bottom line, you can think of OpenTelemetry as a consistent observability framework allowing you to collect “signals”, process, and export them to your observability stack of choice.
The sample application🔗
For demonstration purposes, we will use two ASP.NET Core Services. There is Service A, providing an HTTP-POST endpoint at /ping, and Service B, which exposes an HTTP-POST endpoint at /ping-internal.
Service A acts as a reverse proxy and forwards all incoming HTTP-POST requests hitting/ping to the /ping-internal endpoint of Service B. (The actual reverse-proxy implementation does not matter for the scope of this article, in real-world scenarios, you may consider using things like YARP or run Service B behind an NGINX reverse-proxy).
OpenTelemetry is used to instrument both services and export traces to Jaeger. Metrics provided by both services are also exposed. A Prometheus instance is responsible for scraping every service’s /metrics endpoint and storing them internally.
The following paragraphs outline how to instrument Service B (the backend-service providing /ping-internal). Those steps must be repeated for Service A to collect metrics and traces from both applications to get the whole picture. All code shown in this post is located in the corresponding repository on GitHub.
Instrumenting a .NET Application with OpenTelemetry🔗
The OpenTelemetry SDK is a collection of multiple NuGet packages that we can combine to address our needs and instrument Service B. That said, let’s add our first bunch of “common” dependencies now:
# Add Hosting Package
dotnet add package --prerelease OpenTelemetry.Extensions.Hosting

# Add Instrumentation Packages
dotnet add package OpenTelemetry.Instrumentation.Runtime
dotnet add package --prerelease OpenTelemetry.Instrumentation.Http
dotnet add package --prerelease OpenTelemetry.Instrumentation.AspNetCore
Additionally, we must add dependencies for the exporters we want to use. In this example, we’ll send traces to Jaeger, metrics will be scraped and stored by Prometheus, and logs are simply written to the stdout:
# Add exporter packages
dotnet add package OpenTelemetry.Exporters.Console
dotnet add package --prerelease OpenTelemetry.Exporters.Jaeger
dotnet add package --prerelease OpenTelemetry.Exporter.Prometheus.AspNetCore
Now that we have all dependencies in place, we can start instrumenting Service B.
Provide a signal resource🔗
All signals routed through OpenTelemetry need a so-called resource. The resource provides essential information about the actual application producing the signals.
We can provide a simple Action<ResourceBuilder> in Program.cs and reuse it for all signals.
var assemblyVersion = Assembly.GetExecutingAssembly()
    .GetName().Version?.ToString() ?? "0.0.0";

Action<ResourceBuilder> buildOpenTelemetryResource = builder => {
    return builder
        .AddService("ServiceB",
            serviceVersion: assemblyVersion,
            serviceInstanceId: Environment.MachineName)
        .Build();
};
Configure Tracing🔗
Having the OpenTelemetry.Extensions.Hosting NuGet-Package installed, we can configure tracing in Program.cs by using the AddOpenTelemetryTracing extension method:
builder.Services.AddOpenTelemetryTracing( builder => {
    builder.ConfigureResource(buildOpenTelemetryResource)
        .AddRuntimeInstrumentation()
        .AddAspNetCoreInstrumentation()
        .AddHttpClientInstrumentation()
        .AddJaegerExporter();
});

builder.Services.Configure<JaegerExporterOptions>(builder.Configuration.GetSection("Jaeger"));
The AddRuntimeInstrumentation, AddAspNetCoreInstrumentation, and AddHttpClientInstrumentation methods are provided by the corresponding NuGet packages we added earlier in the article. Last but not least, we instruct OpenTelemetry to send all spans to Jaeger (AddJaegerExporter). We can comfortably configure the Jaeger connection outside the application by providing prefixed (Jaeger__) environment variables.
During development time and for initial troubleshooting purposes, you may want to add the ConsoleExporter, which will write all traces to STDOUT:
builder.Services.AddOpenTelemetryTracing( builder => {
    builder.ConfigureResource(buildOpenTelemetryResource)
        .AddRuntimeInstrumentation()
        .AddHttpClientInstrumentation()
        .AddAspNetCoreInstrumentation()
        .AddJaegerExporter()
        .AddConsoleExporter();
});
Having the configuration to collect and export traces in place, we can give it a shot. At this point, you should start your application, call some APIs and check the console to spot your traces, as shown here:
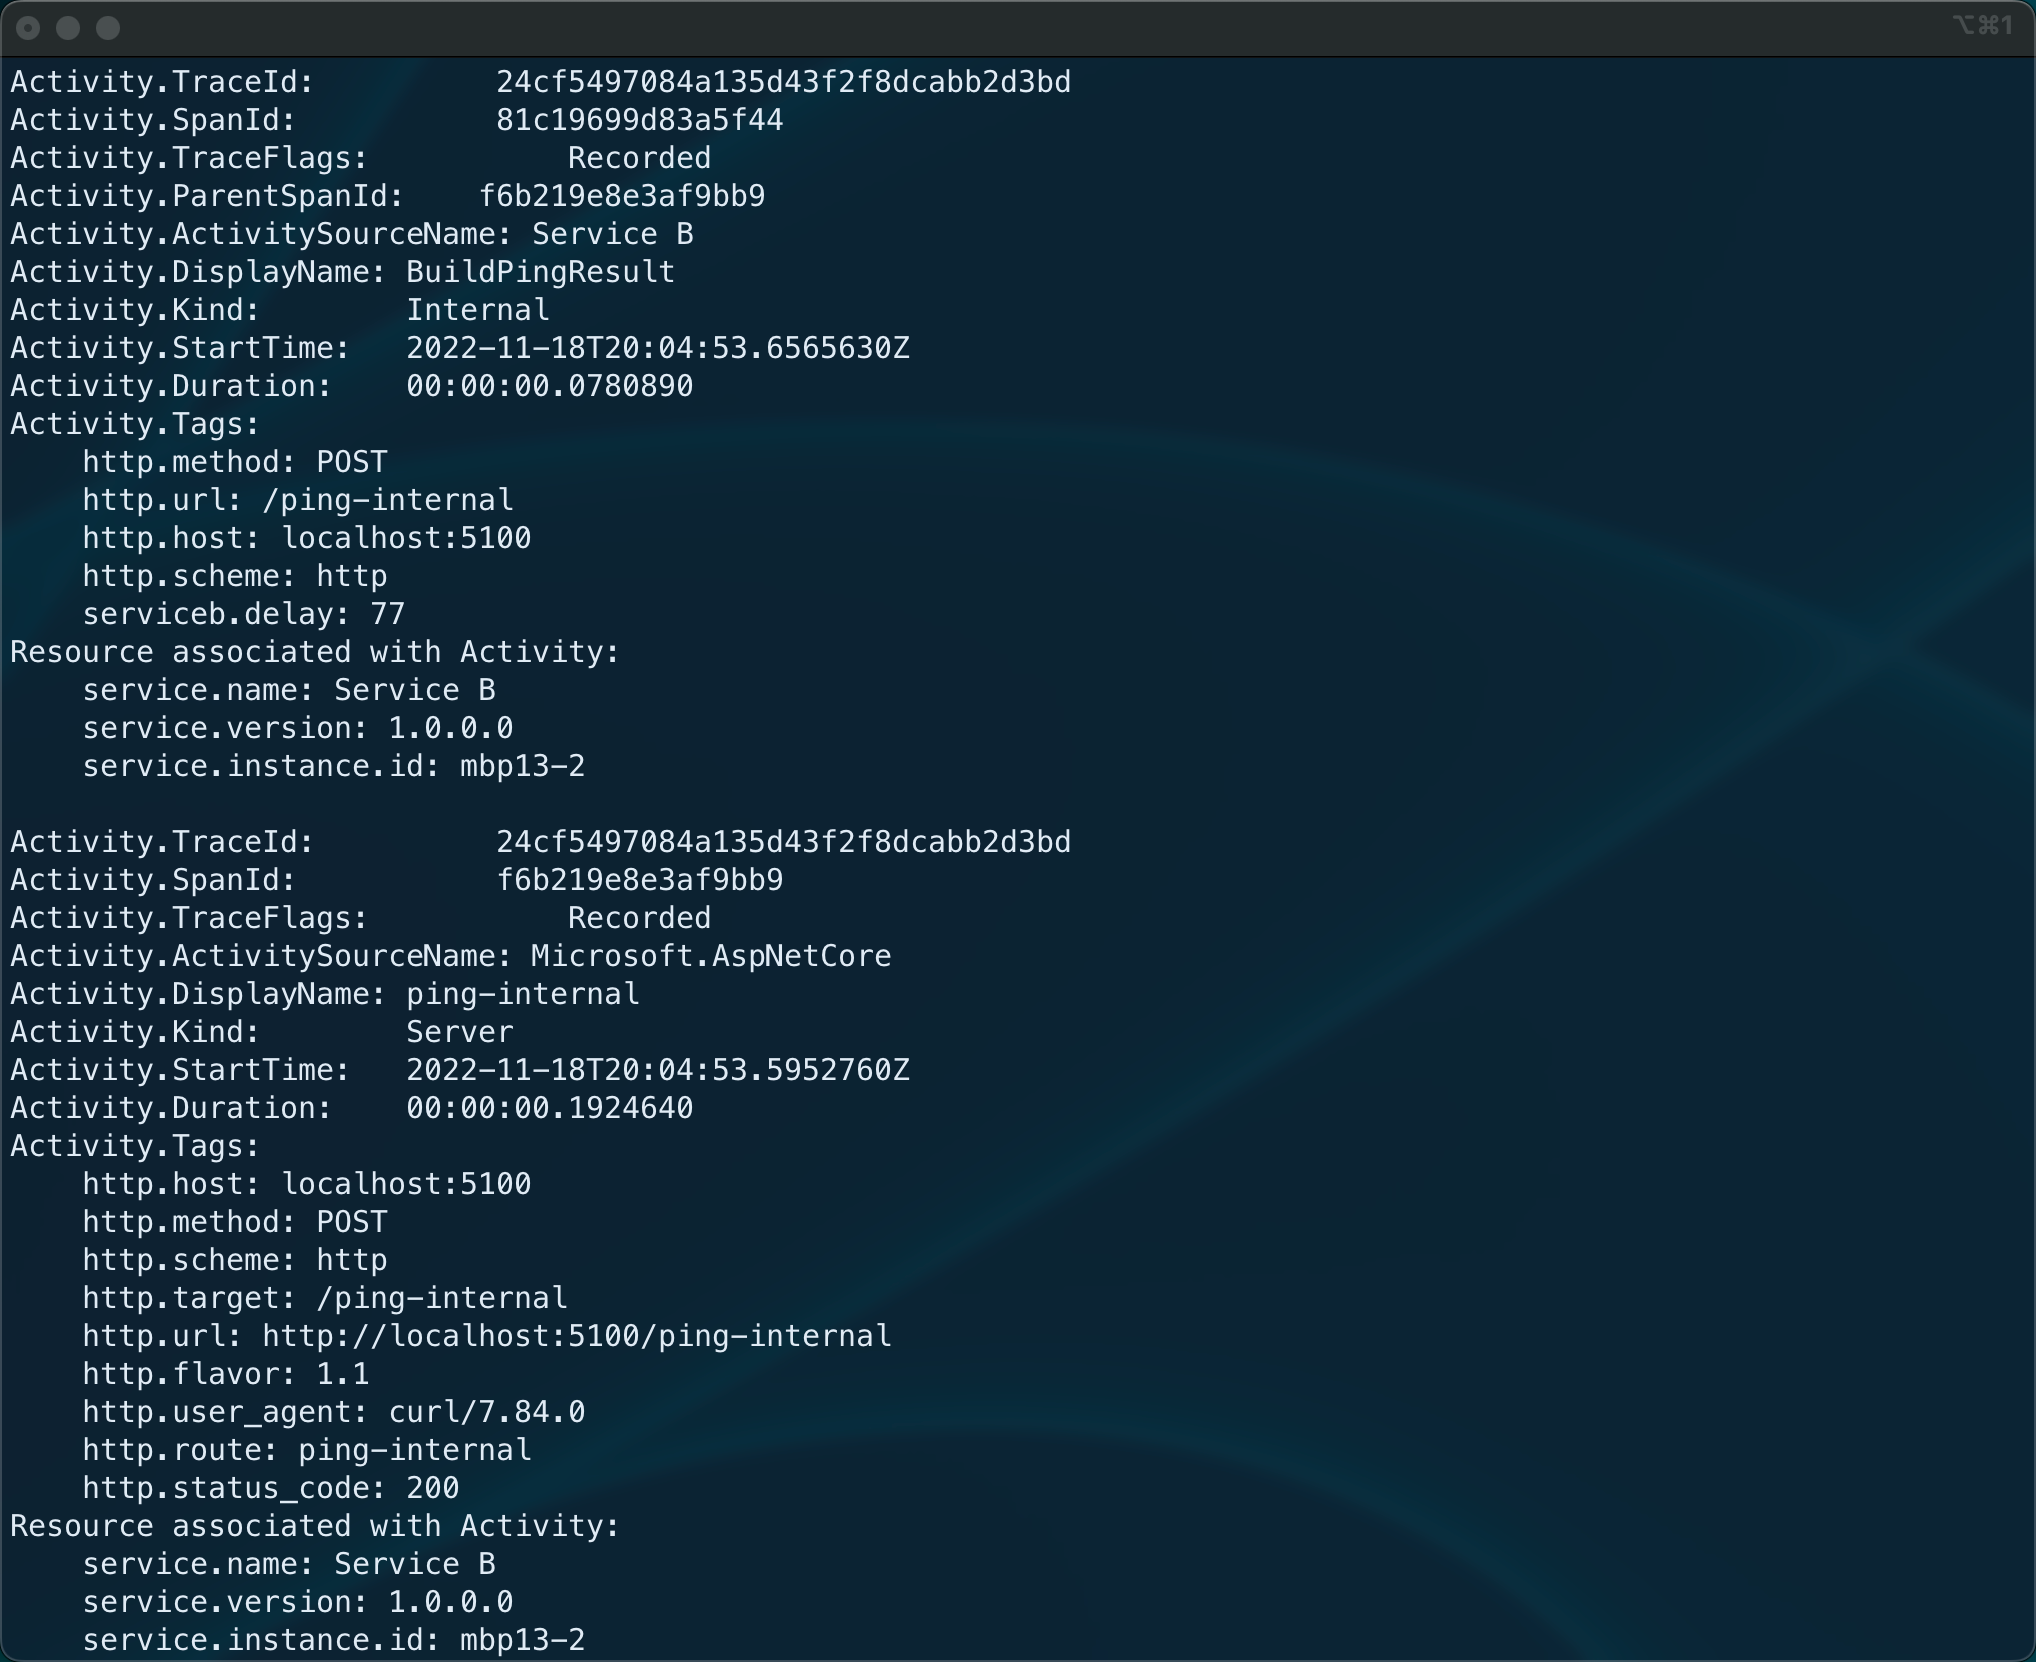
Traces exported to the Console via OpenTelemetry
Configure Logging🔗
We can also use OpenTelemetry to configure logs. This configuration integrates seamlessly with the standard logging stack of .NET. Although this sounds handy initially, I would not recommend using OpenTelemetry for logging.
When you use OpenTelemetry for logging (as shown in the following snippet), you’ll see your structured logs being exported (also to the console) using OpenTelemetry Protocol (OTLP) - according to its specification. This is useful when sending your logs directly to a log processor. However, this results in coupling your application to a log processor, exposing an ingestion endpoint for OTLP logs.
Especially in containerized environments (such as Kubernetes), I would recommend logging to STDOUT and STDERR using plain old JSON. Log processors like FluentBit, logstash, or Promtail can easily collect and process JSON based logs from all your containers without coupling the actual application to it.
builder.Logging.ClearProviders();

builder.Logging.AddOpenTelemetry( options =>
{
    options.ConfigureResource(buildOpenTelemetryResource);
    options.AddConsoleExporter();
});

builder.Services.Configure<OpenTelemetryLoggerOptions>(opt =>
{
    opt.IncludeScopes = true;
    opt.ParseStateValues = true;
    opt.IncludeFormattedMessage = true;
});
If you - for whatever reason - decide to use OpenTelemetry and OTLP for your logs and run the application at this point, you’ll see records being written to the console like this:
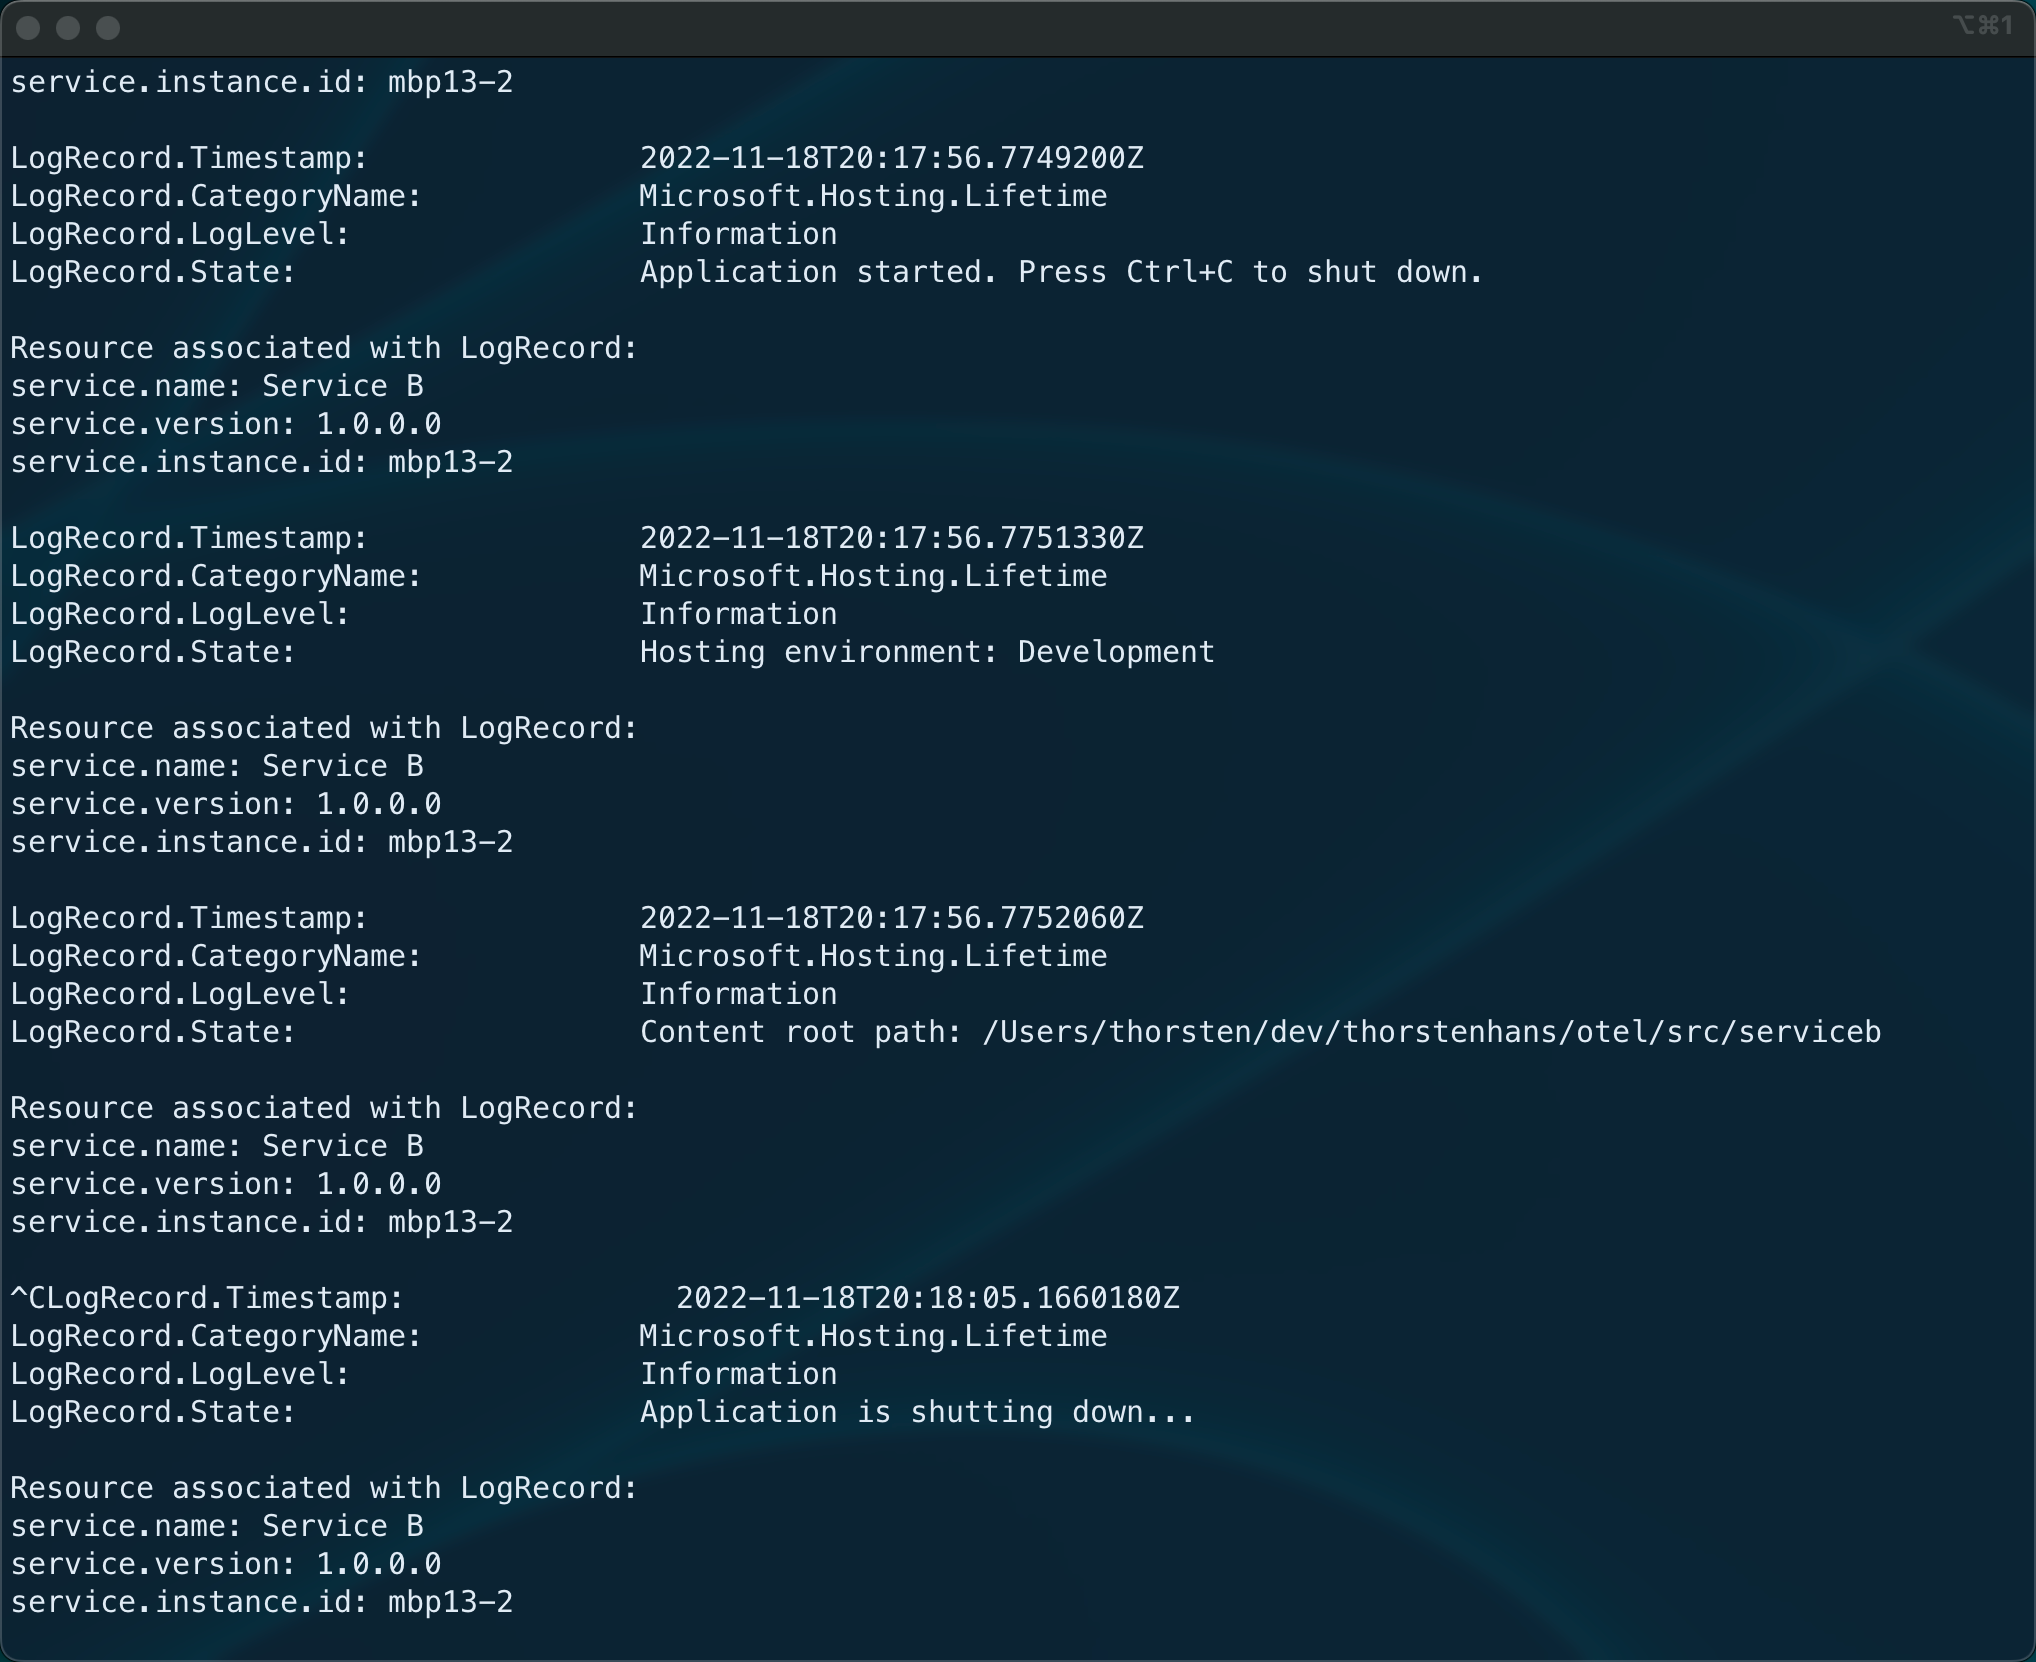
Logs created with OpenTelemetry
Configure Metrics🔗
Having the OpenTelemetry.Extensions.Hosting NuGet-Package installed, we can configure tracing in Program.cs by using the AddOpenTelemetryTracing extension method:
To configure metric collection, we leverage the AddOpenTelemetryMetrics extension method, which is again brought into scope by OpenTelemetry.Extensions.Hosting:
builder.Services.AddOpenTelemetryMetrics( builder =>
{
    builder.ConfigureResource(buildOpenTelemetryResource)
        .AddRuntimeInstrumentation()
        .AddHttpClientInstrumentation()
        .AddAspNetCoreInstrumentation()
        .AddPrometheusExporter();
});
Although we could add the ConsoleExporter also for metrics, I would not recommend doing so; it’s way more convenient to browse the /metrics endpoint to spot metrics during development time and for initial-implementation verification. To expose the /metrics endpoint, typically scraped by Prometheus based on a configurable interval, we have to add the UseOpenTelemetryPrometheusScrapingEndpoint middleware to Program.cs. This middleware should be placed before calling app.Run():
// ...
app.MapControllers();
// ...
app.UseOpenTelemetryPrometheusScrapingEndpoint();
app.Run();
Now that everything is in place, we can start our application and check if metrics are provided at /metrics. You should see a similar response - as shown in the following figure - when hitting the /metrics endpoint with your favorite browser:
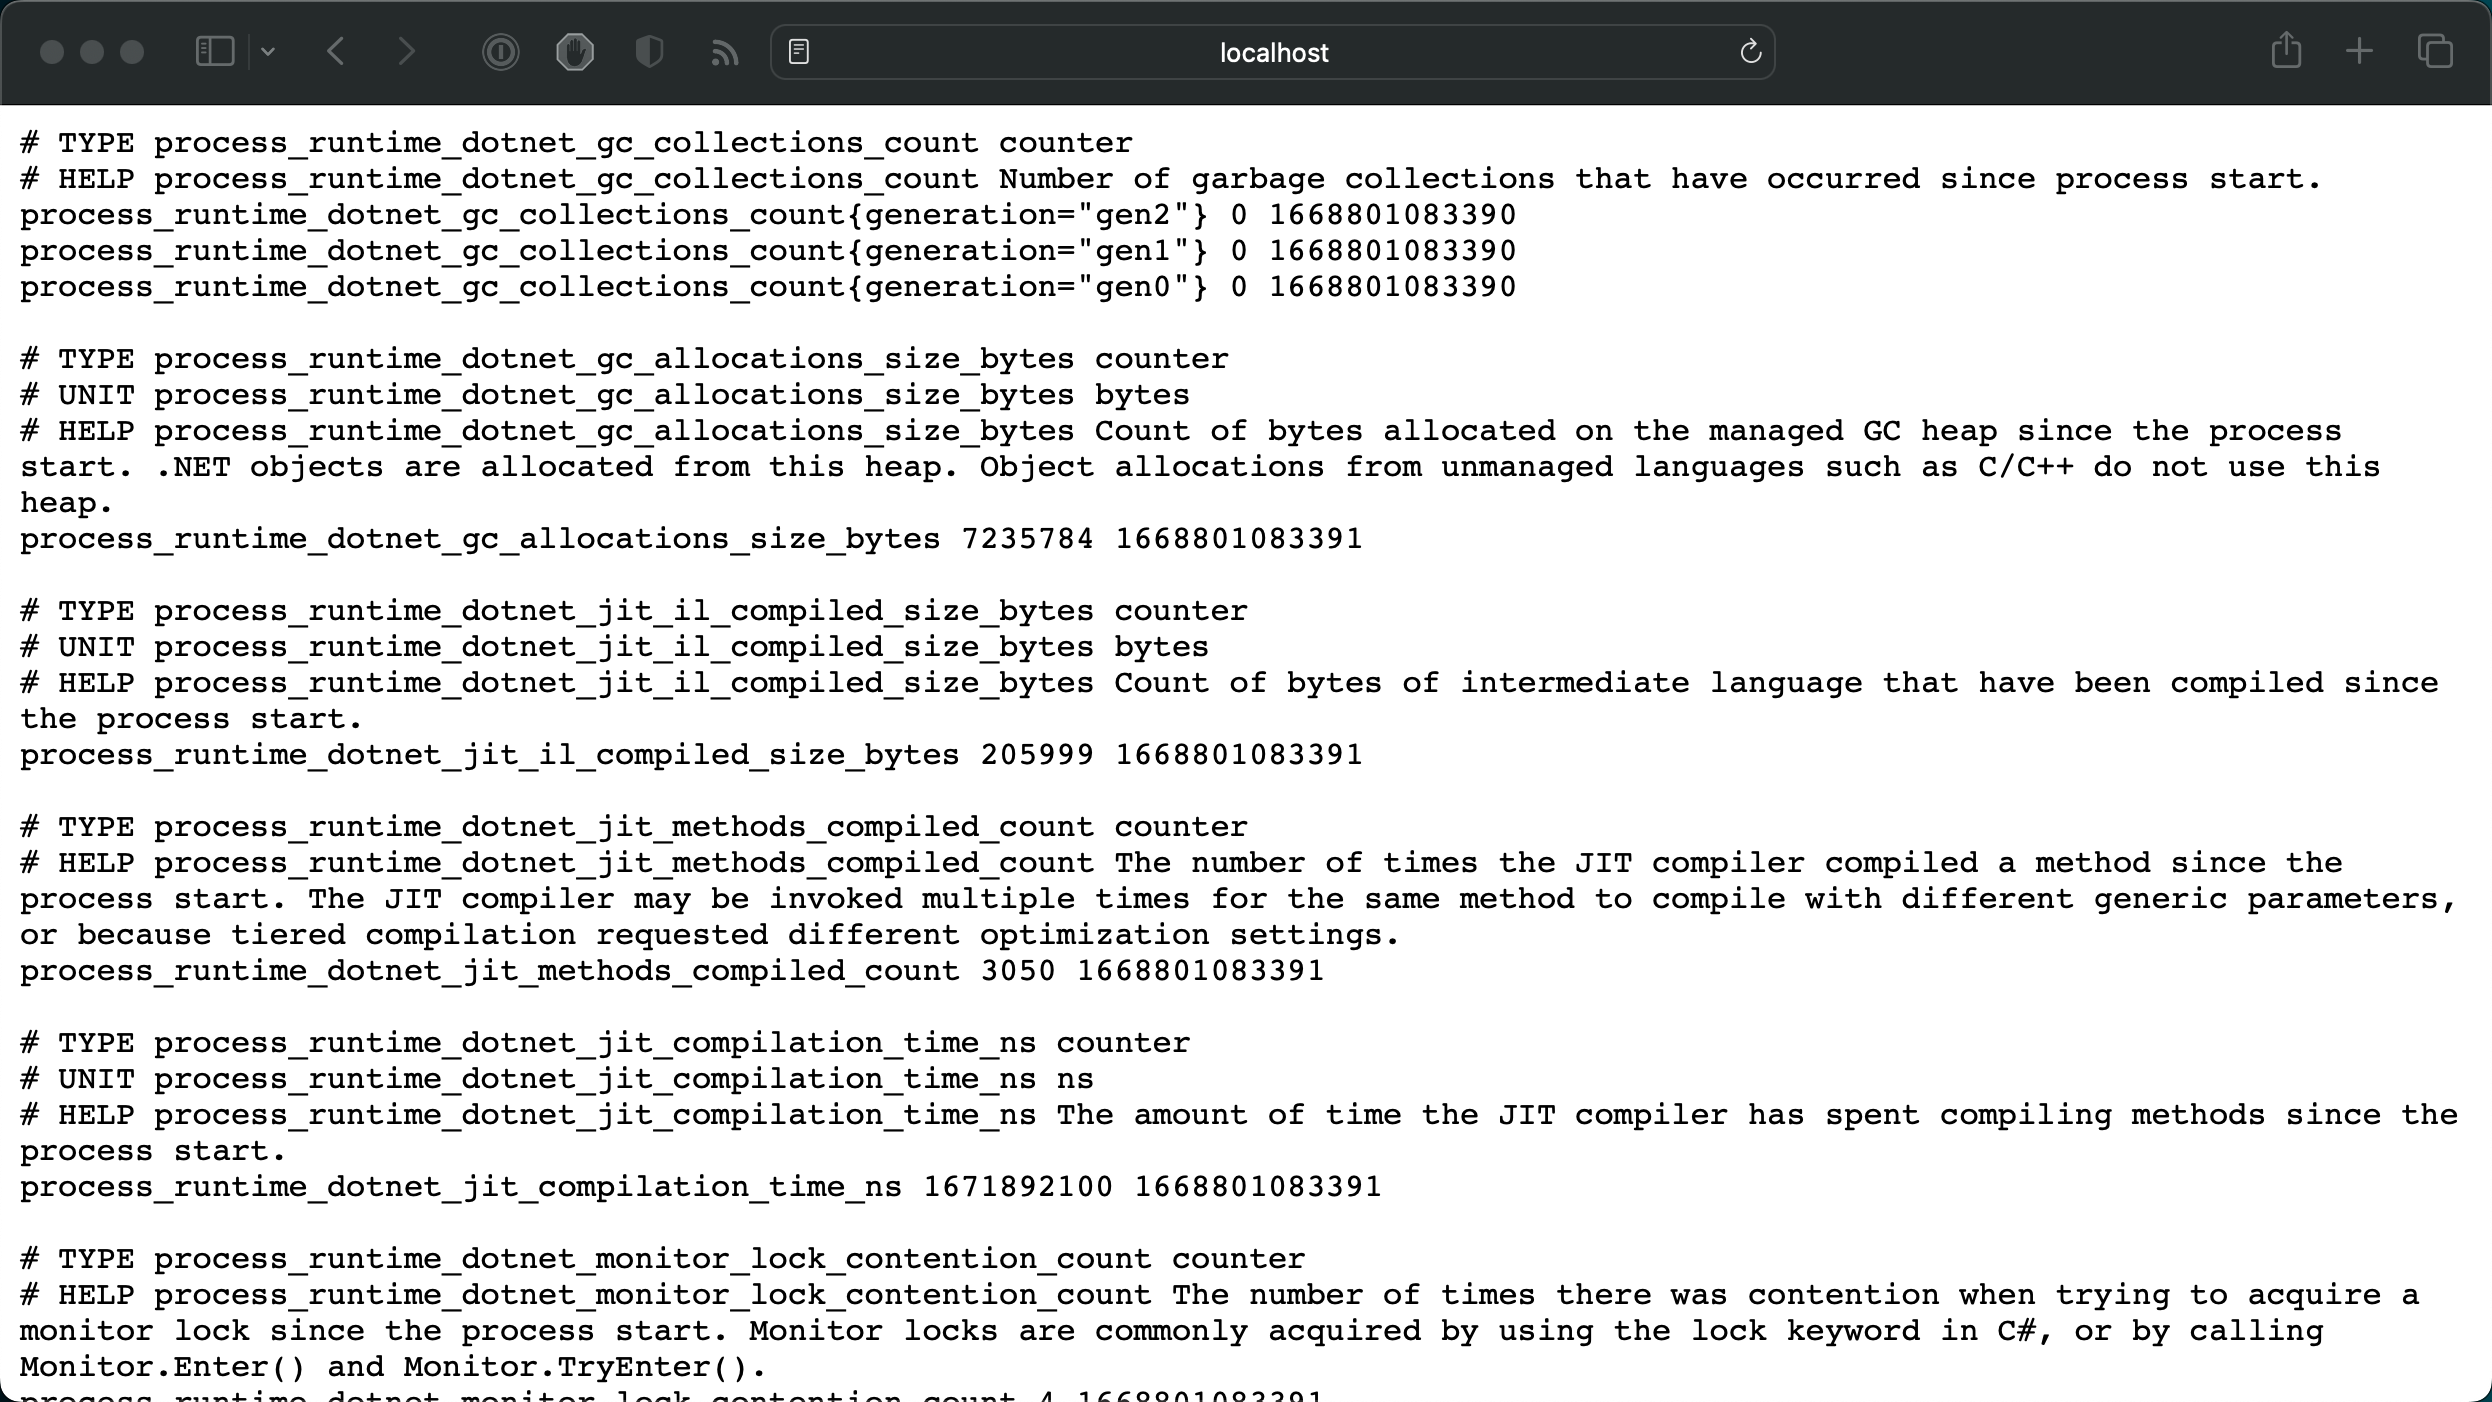
Metrics exposed via OpenTelemetry
Filtering Traces with custom Samplers🔗
Sometimes you may want to filter certain traces. It’s common to prevent health and metrics-scraping endpoints from producing traces. Health endpoints are typically invoked in a very short interval (every 30 seconds, for example) by the surrounding platform to ensure the application is still alive and healthy. Prometheus invokes the metrics endpoint, using a short interval to scrape metrics. Each request would produce traces and flood our observability system (Jaeger here). We can achieve this scenario quickly by providing a custom Processor. The implementation of the CustomProcessor is straightforward:
using System.Diagnostics;
using OpenTelemetry;

namespace ServiceB;

internal sealed class CustomProcessor : BaseProcessor<Activity>
{
    public override void OnEnd(Activity activity)
    {
        if (IsHealthOrMetricsEndpoint(activity.DisplayName))
        {
            activity.ActivityTraceFlags &= ~ActivityTraceFlags.Recorded;
        }
    }

    private static bool IsHealthOrMetricsEndpoint(string displayName)
    {
        if (string.IsNullOrEmpty(displayName))
        {
            return false;
        }
        return displayName.StartsWith("/healthz/") ||
               displayName.StartsWith("/metrics");
    }
}
With the CustomProcessor in place, we’ve to update our AddOpenTelemetryTracing call in Program.cs:
builder.Services.AddOpenTelemetryTracing( builder => {
    builder.ConfigureResource(buildOpenTelemetryResource)
        .AddHttpClientInstrumentation()
        .AddAspNetCoreInstrumentation()
        .AddProcessor<CustomProcessor>()
        .AddJaegerExporter()
        .AddConsoleExporter();
});
Custom signals with OpenTelemetry🔗
Although OpenTelemetry integrates with existing signal sources (TraceProvider, PerfCounters, etc.), you may want to provide custom signals to gain tailored insights about things happening within your application. See the following three sections to understand how to produce custom traces, baggage, and metrics.
Custom Traces🔗
Receiving traces for all requests is super handy and very important in distributed application architectures. However, in real-world applications tons of things happen that may require providing custom spans that will help you pinpoint slow request processing. There are several ways how to produce custom spans in OpenTelemetry. I prefer having a reusable instance of ActivitySource because it is easy to understand and quite handy:
using System.Diagnostics;

public static class CustomTraces {

    public static readonly ActivitySource Default = new ActivitySource("Service B");
}
The custom ActivitySource (CustomTraces.Default) must be registered as part of the tracing configuration in Program.cs by adding AddSource(...):
builder.Services.AddOpenTelemetryTracing( builder => {
    builder.ConfigureResource(buildOpenTelemetryResource)
        .AddHttpClientInstrumentation()
        .AddAspNetCoreInstrumentation()
        .AddSource(CustomTraces.Default.Name)
        .AddJaegerExporter();
        .AddConsoleExporter();
});
To produce a custom span, we use to create a new Activity using the custom ActivitySource:
using Microsoft.AspNetCore.Mvc;

namespace ServiceB.Controllers;

[ApiController]
[Route("")]
public class PingController : ControllerBase
{
    private readonly ILogger<PingController> _logger;
    public PingController(ILogger<PingController> logger)
    {
        _logger = logger;
    }

    [HttpPost]
    [Route("ping-internal")]
    public async Task<IActionResult> PingInternalAsync()
    {
        using (var activity = CustomTraces.Default.StartActivity("BuildPingResult"))
        {
            activity?.SetTag("http.method", Request.Method);
            activity?.SetTag("http.url", Request.Path);
            activity?.SetTag("http.host", Request.Host.Value);
            activity?.SetTag("http.scheme", Request.Scheme);

            var random = new Random().Next(50, 100);
            await Task.Delay(random);
            activity?.SetTag("serviceb.delay", random);
        }
        return Ok(
            new { Status =  "ok"}
        );
    }
}
Custom Baggage🔗
As mentioned earlier in this article, we can use Baggage to provide and transport contextual information when producing tracing, metrics, and logs in distributed applications. Technically, Baggage is a set of key/value pairs that we can - for example - attach to an Activity. The OpenTelemetry SDK provides corresponding AddBaggage, SetBaggage, and GetBaggageItem methods on Activity.
For demonstration purposes, we’ll extend Service A and set the name of our proxy as baggage. This allows us to detect on Service B if /ping-internal was called via proxy.
[HttpPost]
[Route("ping")]
public async Task<IActionResult> PingAsync()
{
    Activity.Current?.AddBaggage("sample.proxy", "Service A");
    // ...
}
In Service B, we use GetBaggageItem to check if sample.proxy is set and produce corresponding logs:
[HttpPost]
[Route("ping-internal")]
public async Task<IActionResult> PingInternalAsync()
{
    CustomMetrics.Pings.Add(1);

    var proxy = Activity.Current?.GetBaggageItem("sample.proxy");
    if (string.IsNullOrWhiteSpace(proxy))
        _logger.LogWarning("/ping-internal called without proxy!!");
    else
        _logger.LogInformation("/ping-internal called from {Proxy}", proxy);
    // ..
}
Custom Metrics🔗
Custom metrics can provide important insights about the actual usage of your application or act as additional data points that you can correlate to existing metrics. To collect custom metrics, we create a Meter and describe the metrics we want to collect. For demonstration purposes, we will collect two metrics. The first metric we will collect is the total number of pings using a Counter. Using a ‘Histogram’, the second metric is used to collect the “processing time” in milliseconds. A histogram shows the value distribution on a scale using boundaries. To provide custom boundaries, we’ll also add an ExplicitBucketHistogramConfiguration:
using System.Diagnostics.Metrics;
using System.Reflection;
using OpenTelemetry.Metrics;

public class CustomMetrics
{

    public static readonly Meter Default = new("ServiceB",
        Assembly.GetExecutingAssembly().GetName().Version?.ToString() ?? "0.0.0");

    public  static readonly Counter<long> Pings =
        Default.CreateCounter<long>("thorstenhans_serviceb_pings",
            description: "Total number of pings");

    public static readonly Histogram<int> PingDelay =
        Default.CreateHistogram<int>("thorstenhans_serviceb_ping_delay",
            "ms", "Think time in ms for a ping");

    public static readonly ExplicitBucketHistogramConfiguration PingDelayView =
        new ExplicitBucketHistogramConfiguration{
            Boundaries = new double[] { 25, 50, 60, 70, 80, 90, 100, 125 }
        };
}
Again we must update our metric configuration and tell OpenTelemetry about our Meter and the custom configuration for the histogram using AddMeter(...) and AddView(...):
builder.Services.AddOpenTelemetryMetrics( b =>
{
    b.ConfigureResource(buildOpenTelemetryResource)
    .AddRuntimeInstrumentation()
    .AddHttpClientInstrumentation()
    .AddAspNetCoreInstrumentation()
    .AddMeter(CustomMetrics.Default.Name)
    .AddView(CustomMetrics.PingDelay.Name, CustomMetrics.PingDelayView)
    .AddPrometheusExporter();
});
Finally, we can update the actual application code and submit our produce our metrics:
[HttpPost]
[Route("ping-internal")]
public async Task<IActionResult> PingInternalAsync()
{
    // publish total number of pings metric
    CustomMetrics.Pings.Add(1);
    var random = new Random().Next(50, 100);
    // publish ping delay metrics
    CustomMetrics.PingDelay.Record(random);
    // ...
    Ok(
        new { Status = "ok" }
    );
}
At this point, every invocation of the /ping-internal endpoint will update custom metrics. Run the application and check the /metrics endpoint once you’ve issued some calls (curl -iX POST https://localhost:5000/ping-internal)
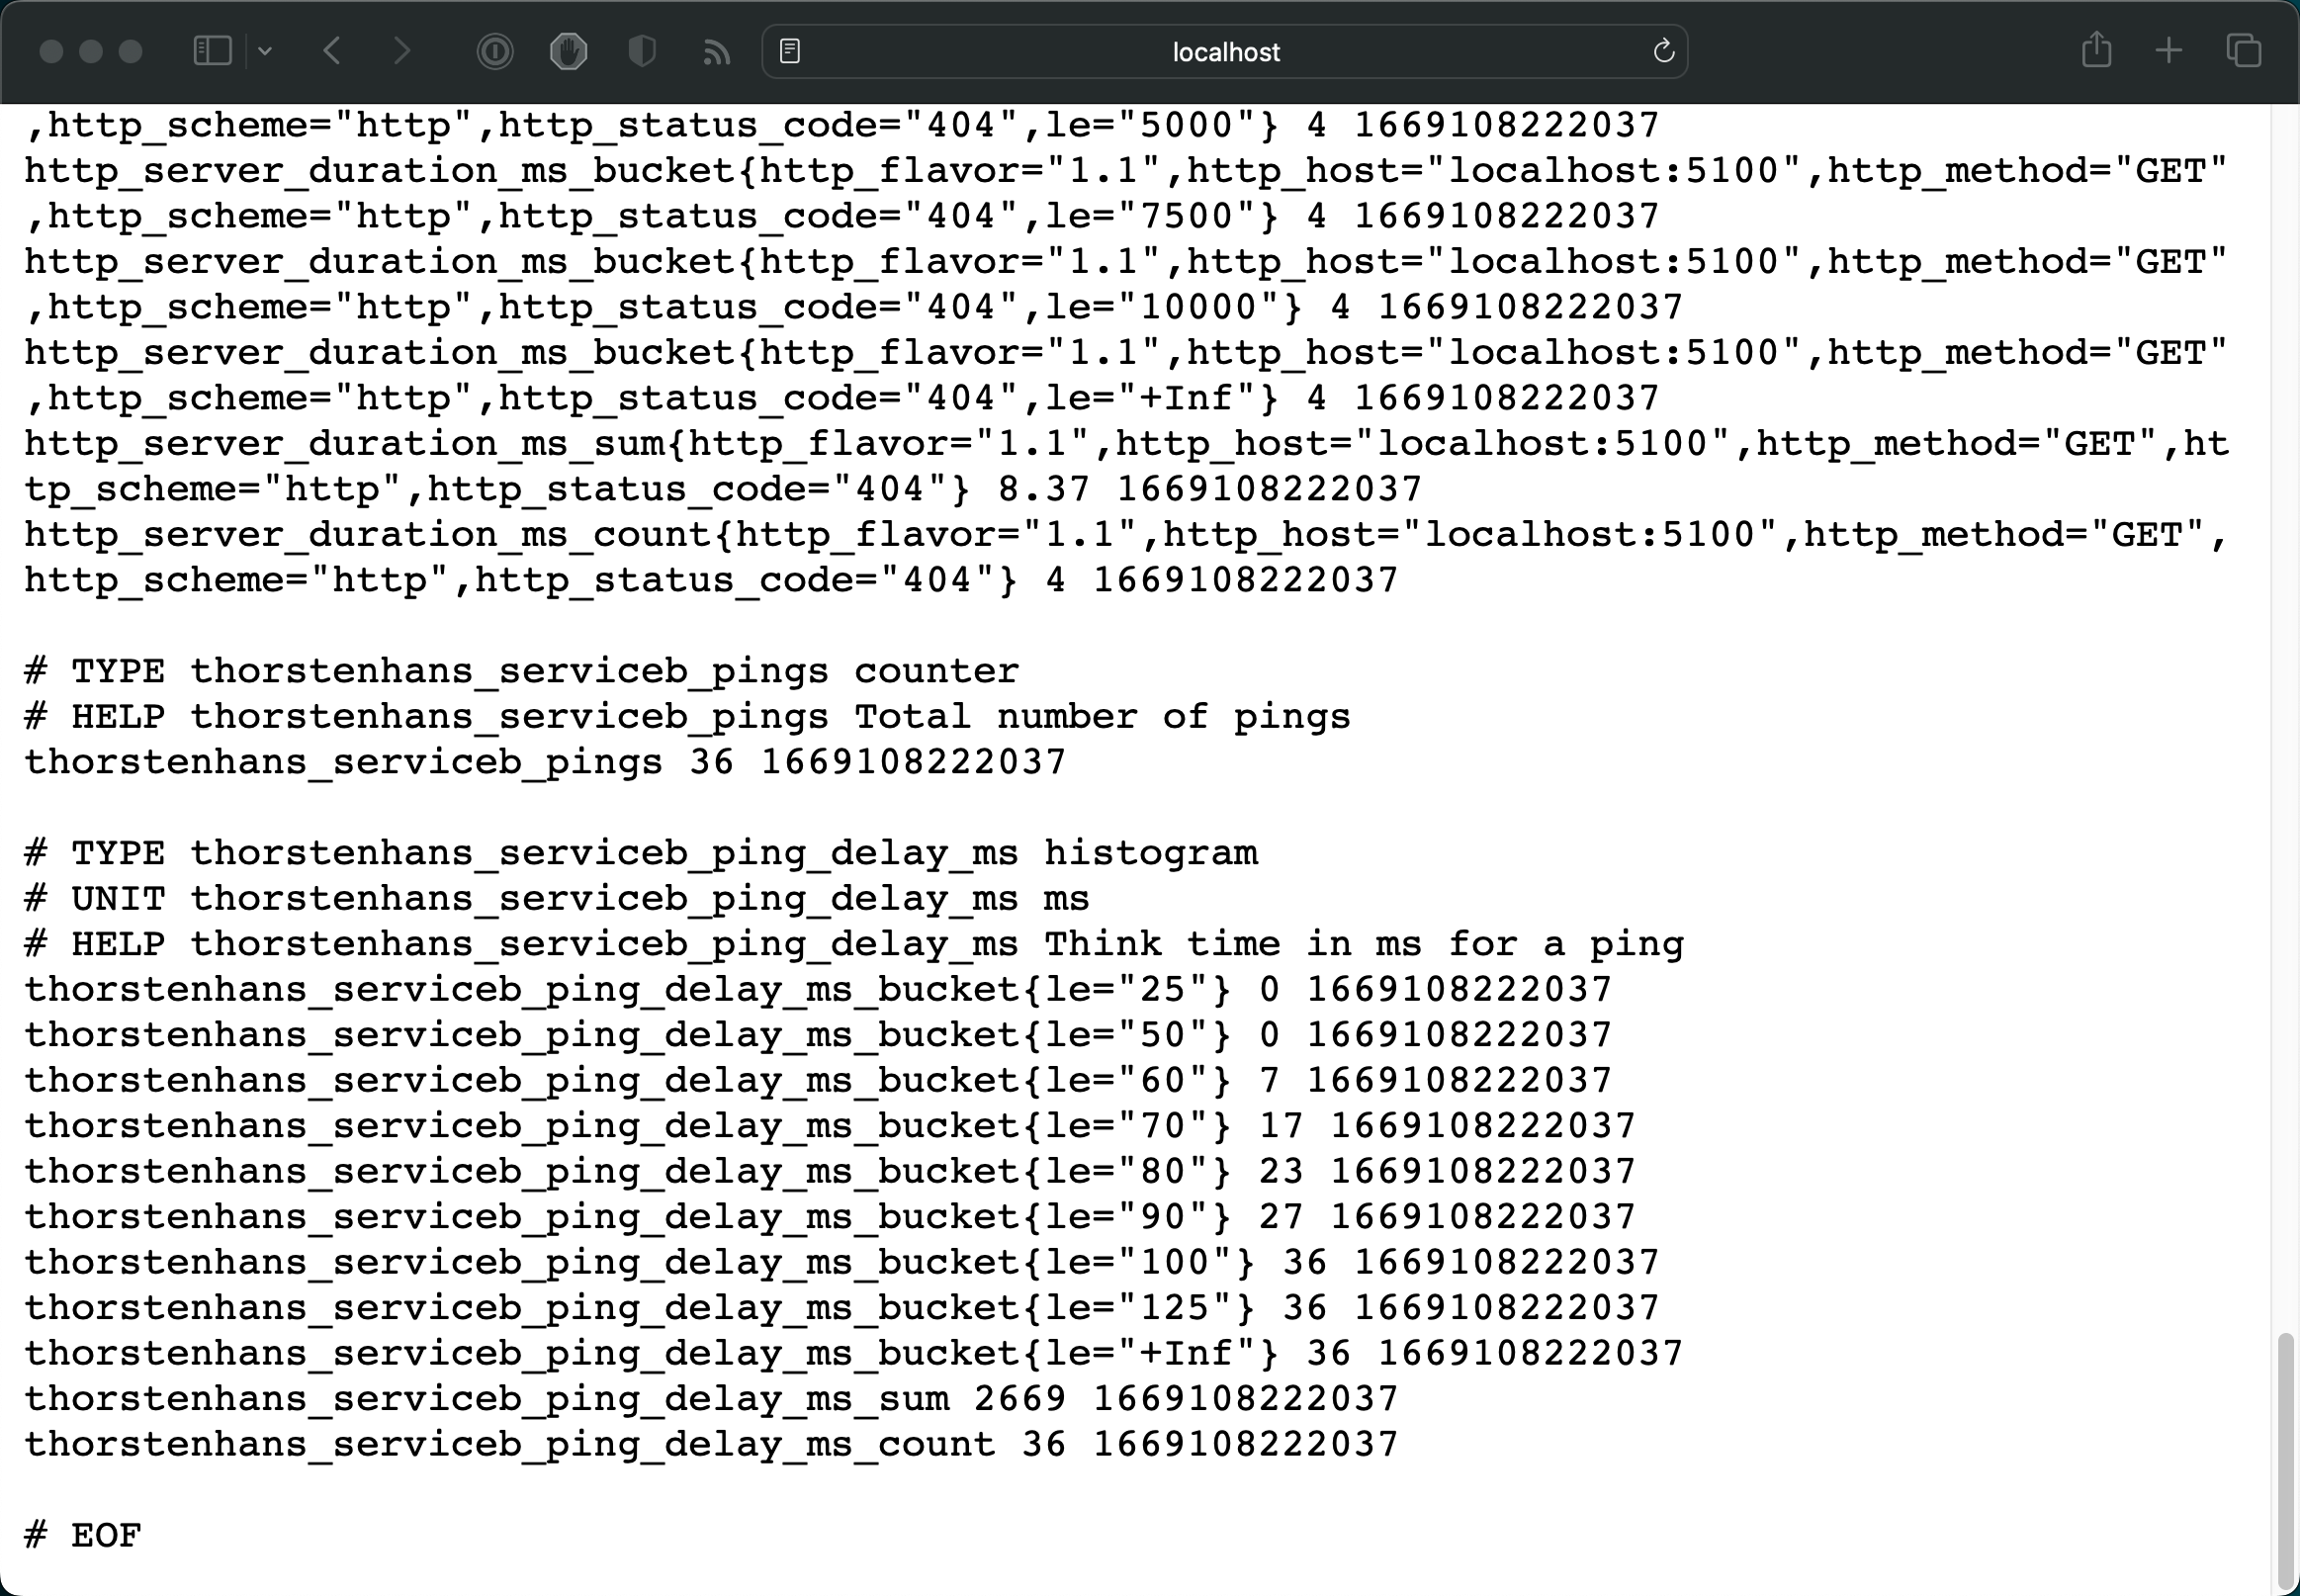
Metrics endpoint locally
Kubernetes Deployment🔗
To verify the instrumentation, we will deploy the dependencies (Jaeger and Prometheus), followed by the sample application, to a Kubernetes cluster. Let’s use Helm to deploy both Jaeger and Prometheus:
# Add Helm repositories for Jaeger and Prometheus

helm repo add prometheus-community https://prometheus-community.github.io/helm-charts
helm repo add jaegertracing https://jaegertracing.github.io/helm-charts

# Update repository lists
helm repo update

# Install Prometheus
helm upgrade --install prometheus -n prometheus \
    --create-namespace \
    prometheus-community/prometheus

# Install Jaeger
helm upgrade --install jaeger -n jaeger \
    --create-namespace \
    jaegertracing/jaeger
Having our dependencies deployed to Kubernetes, we can deploy the actual application. The sample repository contains corresponding Helm charts in the charts/ folder. To deploy the application charts, we must provide the endpoint for Jaeger:
# Install Service B
helm install service-b charts/service-b -n services --create-namespace \
   --set jaeger.host=jaeger-agent.jaeger.svc.cluster.local \
   --set jaeger.port=6831

# Install Service A
helm install service-a charts/service-a -n services --create-namespace \
    --set jaeger.host=jaeger-agent.jaeger.svc.cluster.local \
    --set jaeger.port=6831 \
    --set backend.host=service-b.services.svc.cluster.local \
    --set backend.port=8080
Additionally, the repository contains a load generator that we can deploy to the same Kubernetes cluster to put some pressure on the sample application. You can run the load generator using the following command:
# run the load generator in Kubernetes
kubectl run load-generator -it --rm \
  --namespace services \
  --image=thorstenhans/otel-sample-load-generator:0.0.1 \
  --restart=Never
You can terminate the load generator at any time using Ctrl+C. The Pod will be deleted automatically due to the --rm flag being specified as part of the kubectl run command.
Query traces using JaegerUI🔗
To verify that our traces have been sent to Jaeger, we can browse the Jaeger UI. Let’s quickly setup port-forwarding to access the Jaeger UI from the local machine:
# Port-Forward to JaegerUI
kubectl port-forward -n jaeger \
    services/jaeger-query 8080:80
We can now browse Jaeger UI at http://localhost:8080and dive through the traces produced by our example application.
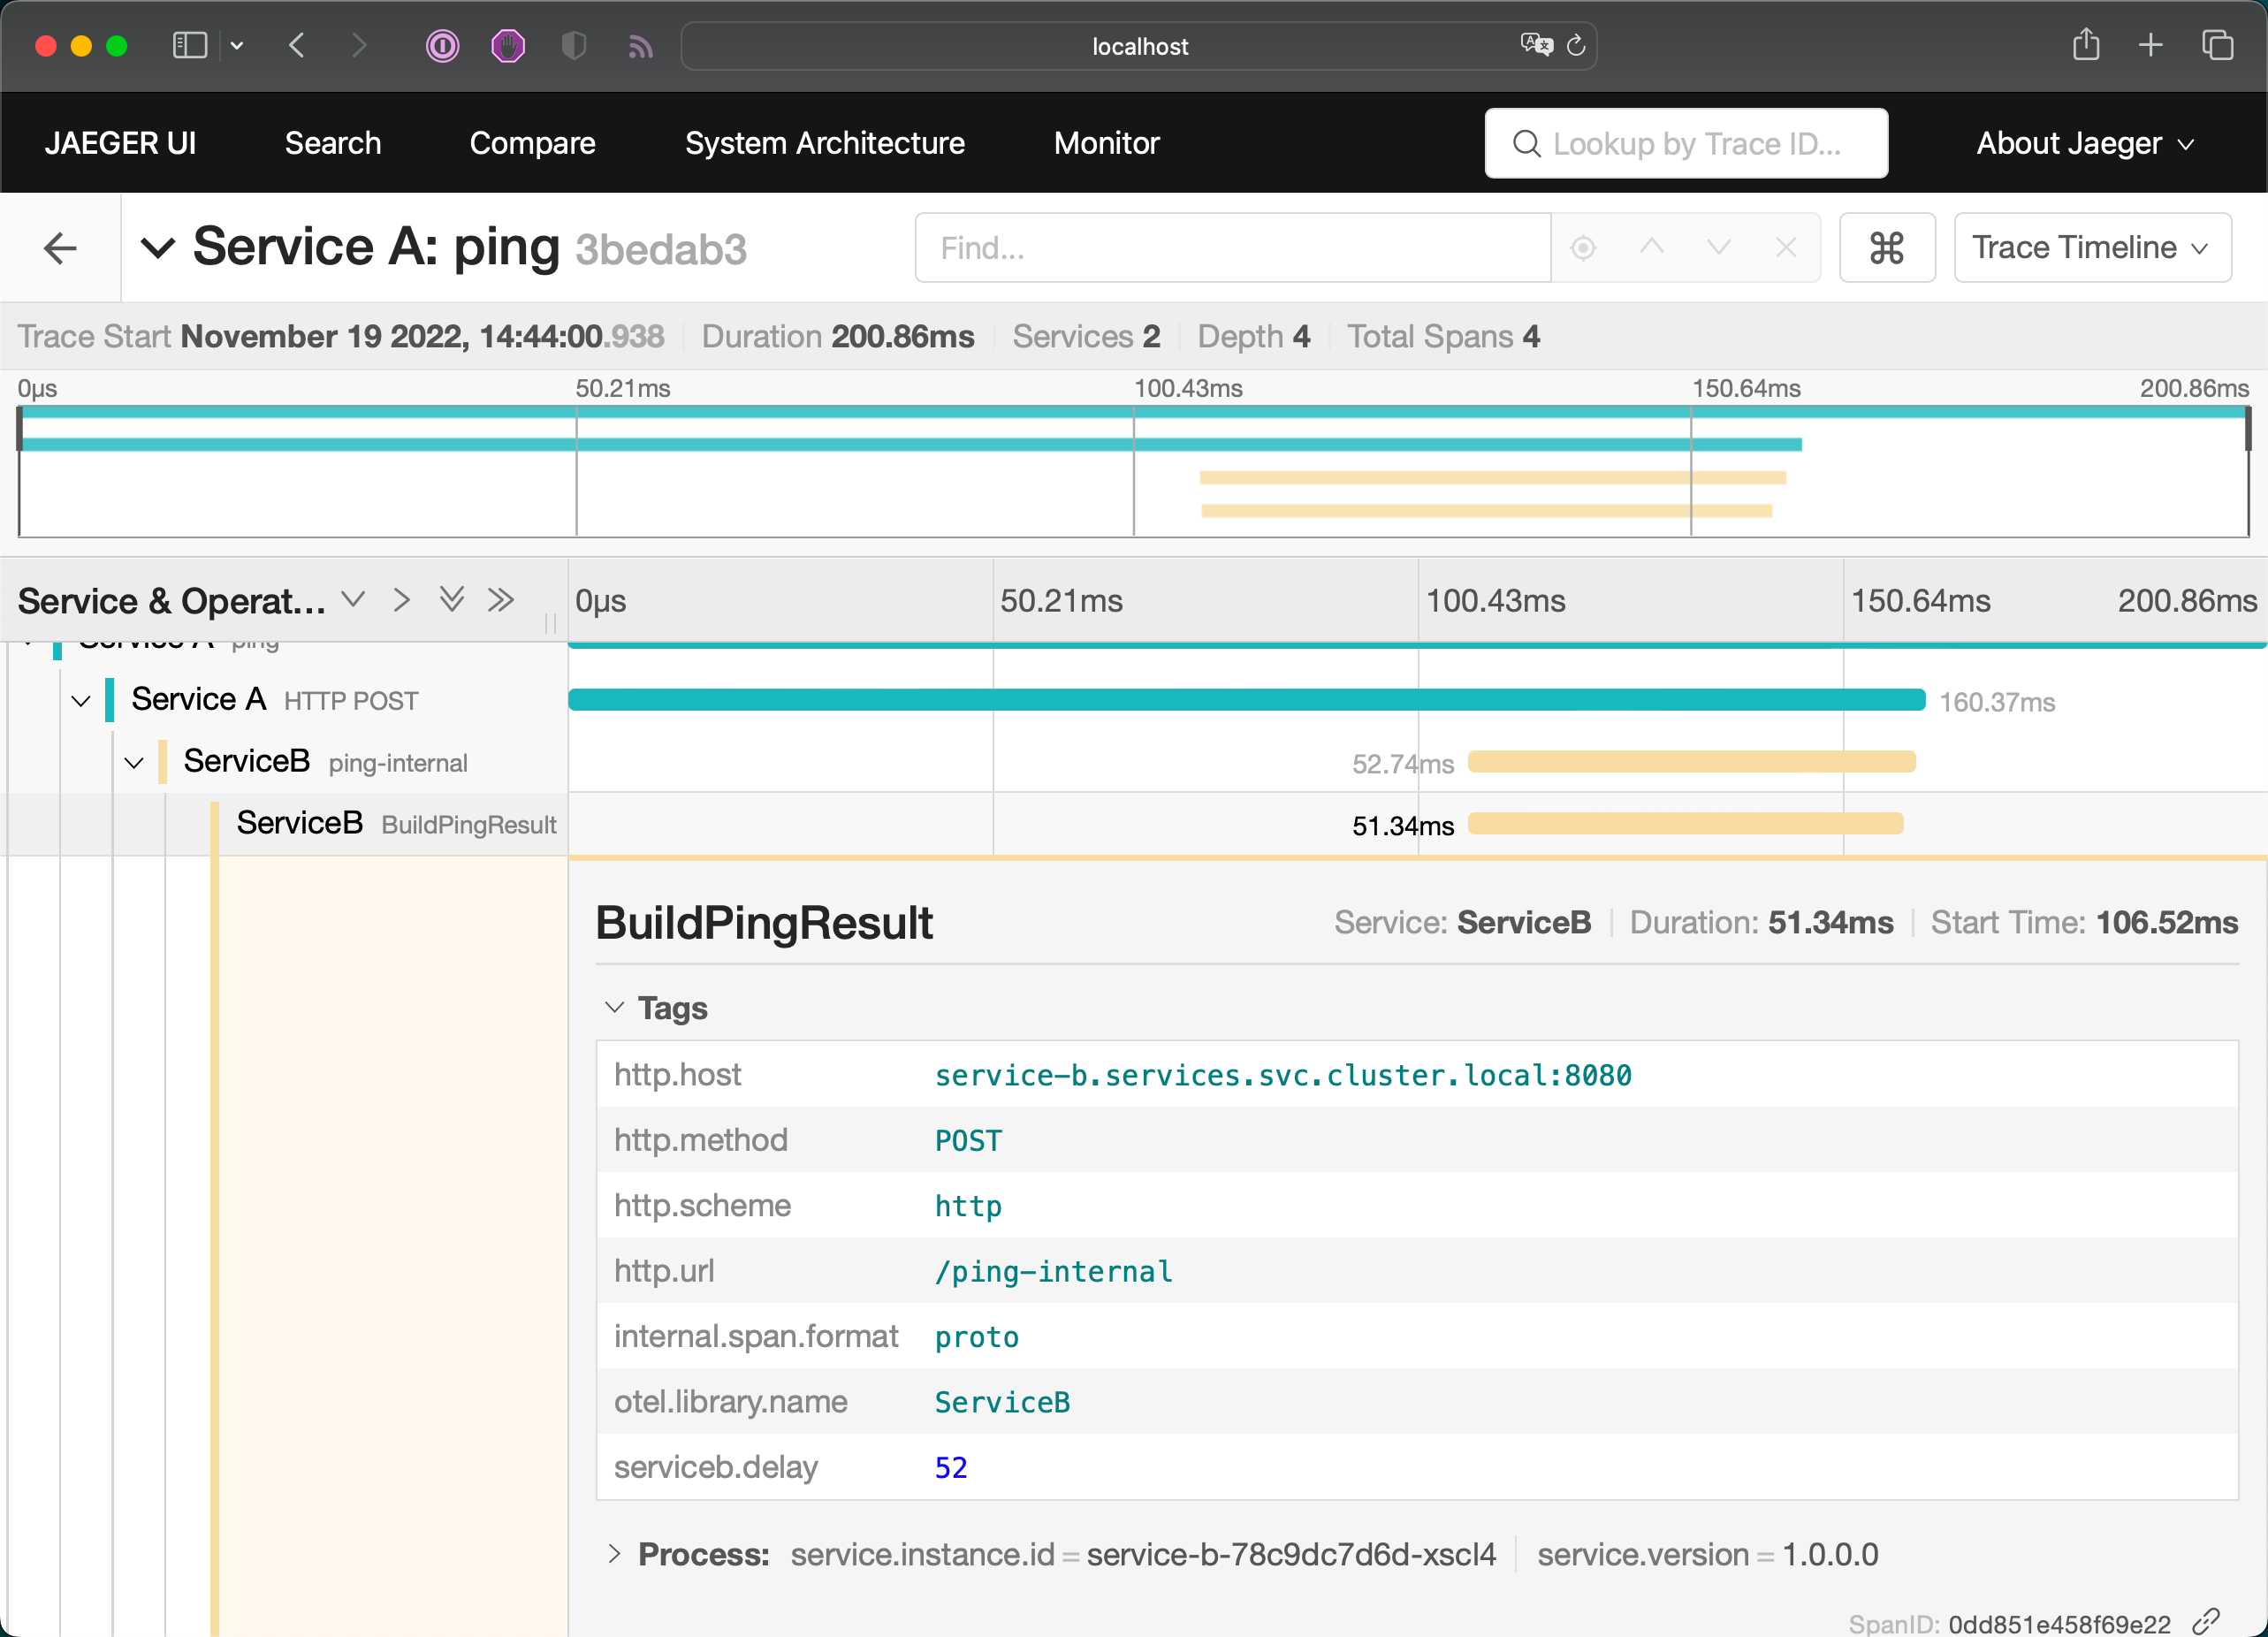
Distributed Traces in Jaeger
Stop port-forwarding for Jaeger UI at this point. (Ctrl+C)
Query metrics using Prometheus QueryUI🔗
To verify our metrics were scraped by Prometheus, let’s also set up a port-forwarding to access Prometheus from our local machine:
# Port-Forward to Prometheus
kubectl port-forward -n prometheus \
    services/prometheus-server 8080:80
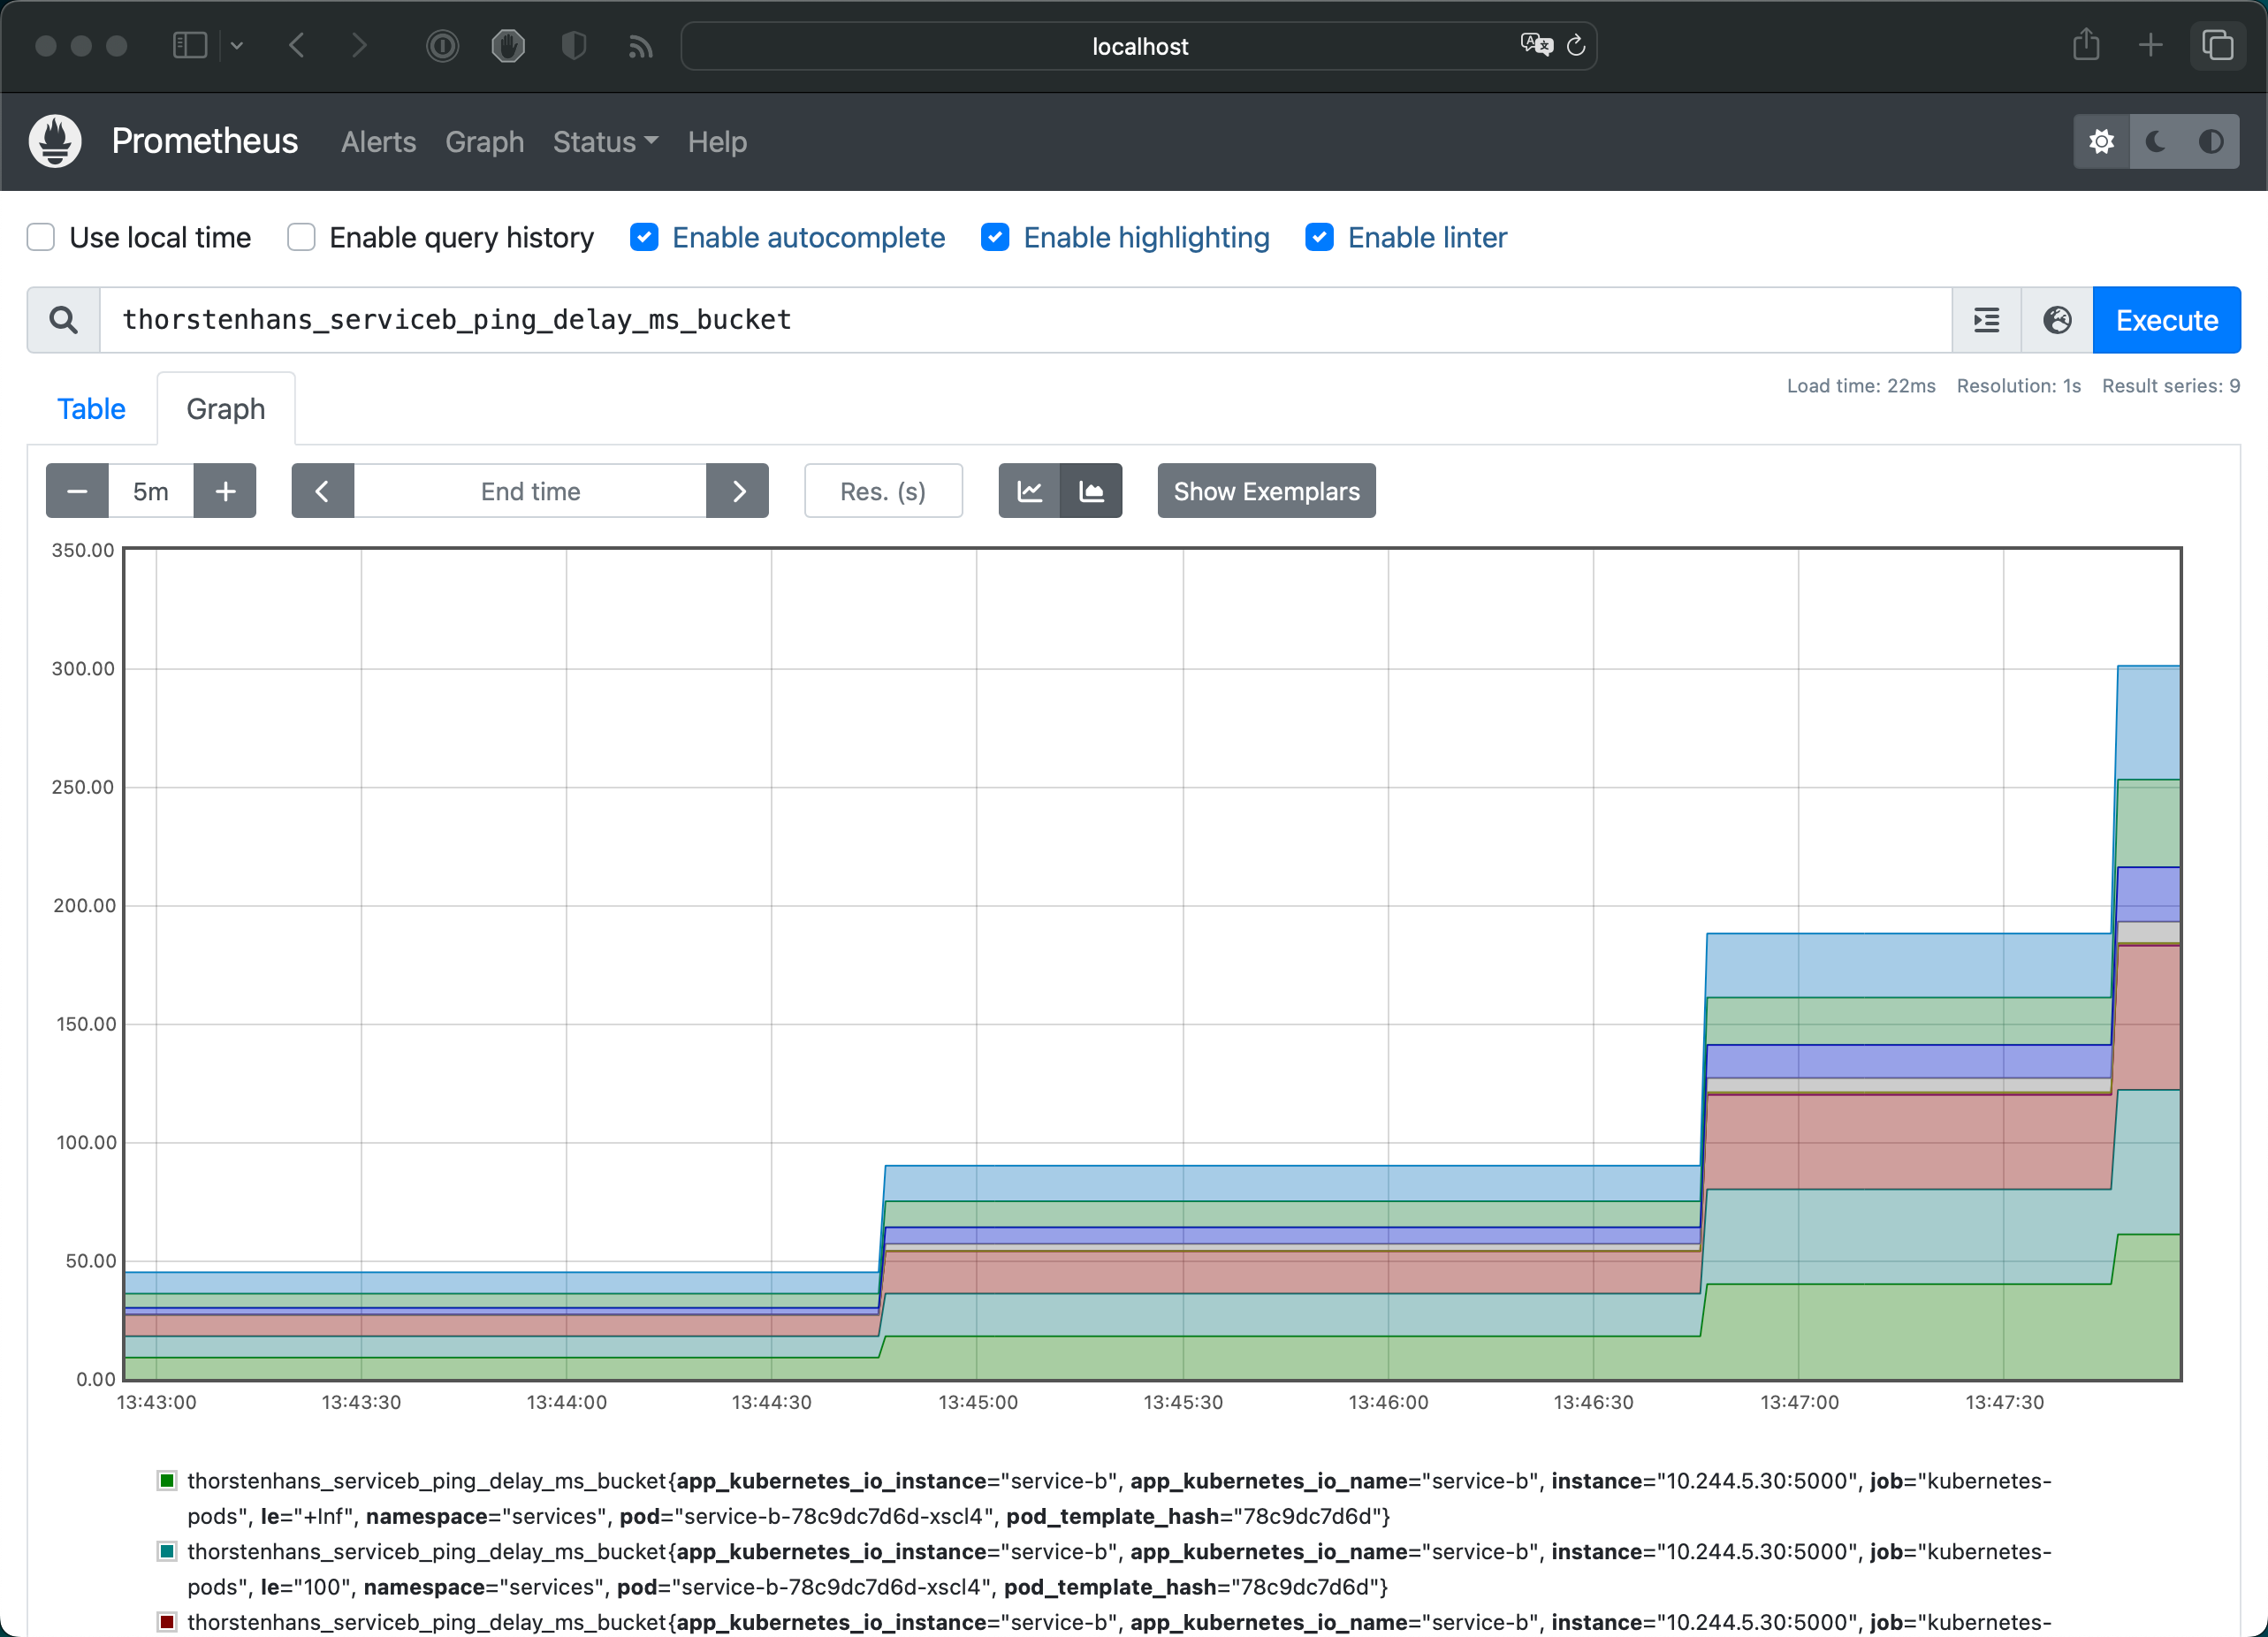
Custom Metrics in Prometheus
What we’ve covered in this article🔗
- 💡 Learned what OpenTelemetry is
- 🧊 Instrumented an ASP.NET Core application
- ⚙️ Configured .NET Logging using OpenTelemetry
- 🏹 Published standard and individual traces to Jaeger
- 🌍 Exposed standard and individual metrics for Prometheus
- 👷🏻♂️ Deployed our sample application along with its dependencies to Kubernetes
- 🔎 Queried Jaeger and Prometheus to spot custom traces and metrics
Conclusion🔗
OpenTelemetry is a holistic observability framework developers can use to implement all-the-things observability. It already has a wide adoption because OpenTelemetry acts as a unified layer for logs, metrics, and traces, regardless of which observability stack you may face. Additionally, it provides SDKs for various programming languages, ensuring teams using multiple languages can use the same terms and approaches to implement observability in different applications.
I think OpenTelemetry provides the best value regarding metrics and traces. The flexibility to swap exporters and ensure that both signals were sent to my observability stack of choice is super helpful. So far, I have used OpenTelemetry with .NET, Rust, and GoLang. Although instrumenting .NET and Rust applications could be made in a couple of minutes, the implementation for GoLang was a bit too wordy. I hope that the GoLang modules will be improved in the future.